Applies to BTField version 15.3.38 and onward.
Overview
The Overlay Easting/Northing Points feature drops a layer of labelled reference points onto the map from a list of UTM coordinates. Typical uses are plotting known item locations, ground‑truth seeds, stake‑out points, or any external coordinate list you want to see alongside the survey data.
Each overlay point carries an optional text label. Labels are saved with the workspace, so they survive saving and reloading the project.
Overlay points are created as a site‑polygon points layer, so they share the Site Polys infrastructure: they are grouped under a layer name and can be given a colour override.
Opening the dialog
Right‑click the grid view and choose Overlay Easting/Northing Points. This opens the Overlay Easting/Northing Points dialog.
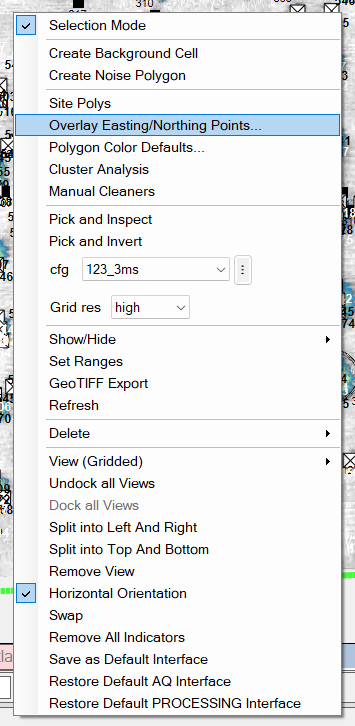
The Overlay Easting/Northing Points dialog
The dialog lets you:
- Name the overlay layer (the Layer name field, pre‑filled with a timestamped
default such as
Overlay_20260601_203141). The name is used as a grouping prefix so all points in one import stay together and can be toggled or recoloured as a unit. - Provide the points, either by:
- Pasting a multi‑line block of
Easting, Northing[, Label]values directly into the Paste points text box, or - Loading a file with Load CSV… or Load XLSX….
- Pasting a multi‑line block of
- Set the layer colour with the Color… button; the swatch beside it shows the current selection (otherwise the points inherit the default colour — see Polygon colour customisation).
Press Import to commit the points to the workspace, or Cancel to discard.
Input format and auto‑detection
The Easting/Northing parser is forgiving about formatting. It automatically detects:
- Column count — two columns (
Easting Northing) or three columns (Easting Northing Label). - Separators — tabs, commas, spaces, or semicolons (these may even be mixed between lines).
- A header row — if the first row’s coordinate fields are non‑numeric, it is treated as a header and skipped.
If a point has no label, it is given a sequential number (1, 2, 3, …).
Coordinates are taken as‑is. Values are interpreted as Easting/Northing in the workspace’s working CRS (WGS‑84 / UTM). BTField does not reproject. See BTField’s coordinate assumption.
Coordinate‑swap warning
If the values look like Easting and Northing have been reversed (UTM Northing is typically greater than 1,000,000 in the northern hemisphere, while Easting is typically 100,000–1,000,000), BTField shows a warning so you can confirm or fix the column order before importing.
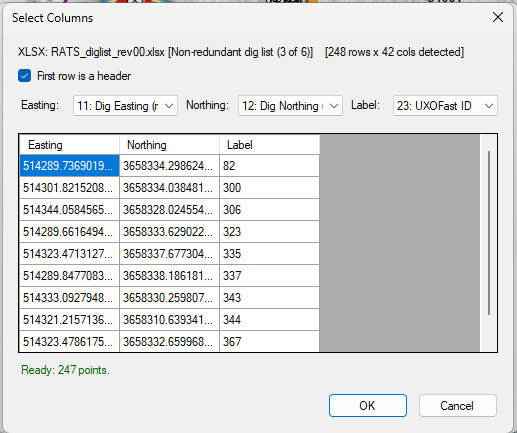
Choosing columns when loading a file
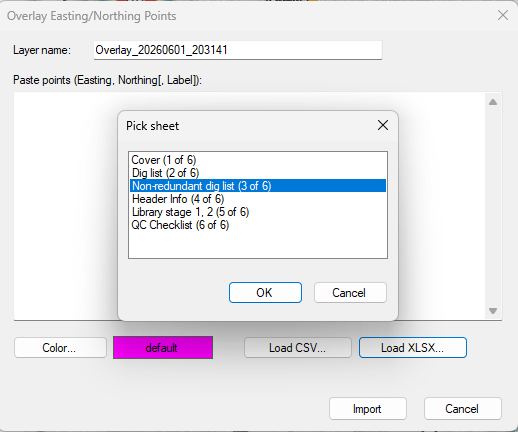
When you load an XLSX file that contains more than one worksheet, BTField first shows
a Pick sheet dialog listing the sheets in the workbook. Select the sheet that holds
the coordinate list and click OK.
BTField then opens the Select Columns dialog so you can map the file’s columns to Easting, Northing, and (optionally) Label:
- First row is a header — tick this if the first row contains column titles; it is then skipped and the titles are used to label the drop‑downs.
- Easting / Northing / Label drop‑downs — choose which column supplies each value.
The header reports the detected size (e.g.
248 rows x 42 cols detected). - A preview grid shows the resolved Easting, Northing, and Label values, and a
status line (e.g.
Ready: 247 points.) reports how many valid points were found.
The picker repeats the coordinate‑swap warning if the chosen Easting/Northing columns look reversed.
.xlsx (Office Open XML) files. It does not read legacy .xls files or encrypted workbooks. If a spreadsheet will not load, save it as .xlsx or export it to .csv first.Displayed result
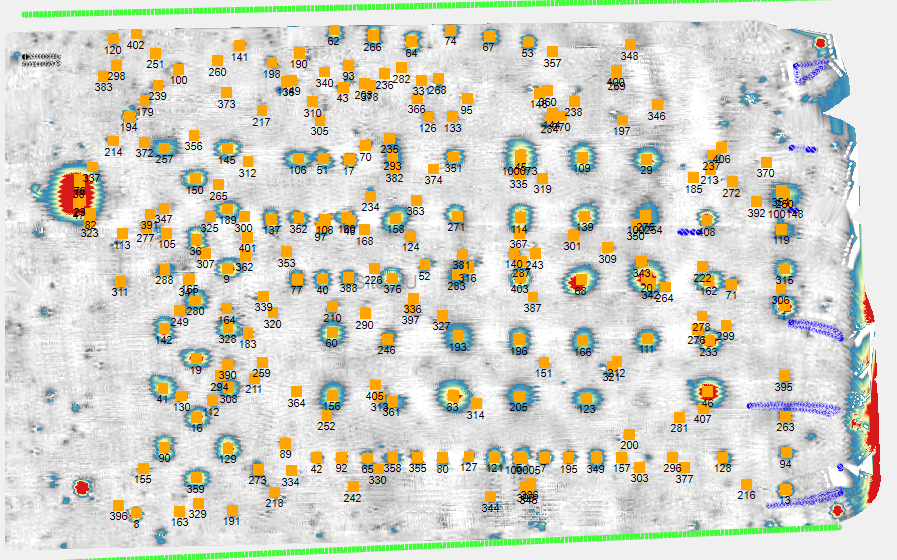
After import, the overlay points appear on the map with their labels drawn next to each point. Because the labels are persisted with the workspace, they reappear exactly as imported the next time the project is opened.