Pre-requisites
- A One-Pass license is required for Decision Plots.
- New-style Decision Plots require a one-time Decision Plot runtime on the machine. The BTField installer sets this up automatically: see Software Installation. If the runtime is not present, BTField automatically produces the older-style Decision Plots and shows a notice.
Decision Plot styles
BTField produces Decision Plots in one of two styles:
- New style: the current, higher-quality layout. Requires the Decision Plot runtime installed by the BTField installer.
- Older style: the previous layout, always available and needing no additional runtime.
The style is selected automatically: when the Decision Plot runtime is available BTField produces new-style plots; otherwise it produces older-style plots and lets you know. You do not choose the style directly.
Generating Decision Plots
- Open the Generate Dig List Reports dialog. To produce Decision Plots, select Dig List and Decision Plots:
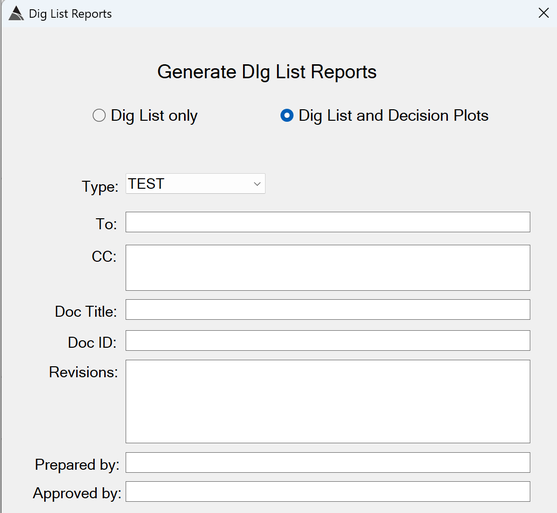
Generate Dig List Reports dialog with Decision Plot options. The dialog options are:
- Report type — Dig List only, Dig List and Decision Plots, or Dig List and VoS Score. Select Dig List and Decision Plots to generate the plots. (For Dig List and VoS Score, see Validation of System (VoS) Scoring.)
- Dig # range: optionally restrict output to a range of dig numbers (leave blank for all).
- Filter: choose which dig-list filter the report is built from. Selecting the Dig List filter outputs all sources on the dig list, including redundant models; selecting the Non-Redundant Dig List filter outputs only the non-redundant sources.
- Type, Doc Title, Doc ID, Prepared by, Approved by (and To / CC / Revisions): document-control details that populate the header of the new-style Decision Plots.
-
A PDF is generated for each target in the selected filter. All Decision Plot PDFs are saved to an auto-created folder that also contains the Dig List Excel report.
- Open a plot directly from the Dig List Excel report. In the generated Dig List workbook, each target’s Target number and Fast ID are hyperlinks: click one to open that target’s Decision Plot PDF from the same folder.
What a Decision Plot shows
Each Decision Plot PDF includes:
- A header identifying the site and the document details (document type, title, and ID, along with prepared/approved fields).
- The predicted model location on the gridded data, with dig / non-dig markers for the target and nearby targets (see the marker key below).
- The measured polarizabilities together with the three best-matching library polarizabilities.
- The signal amplitude (in uV/A), the data-fit value, and the classification category and result.
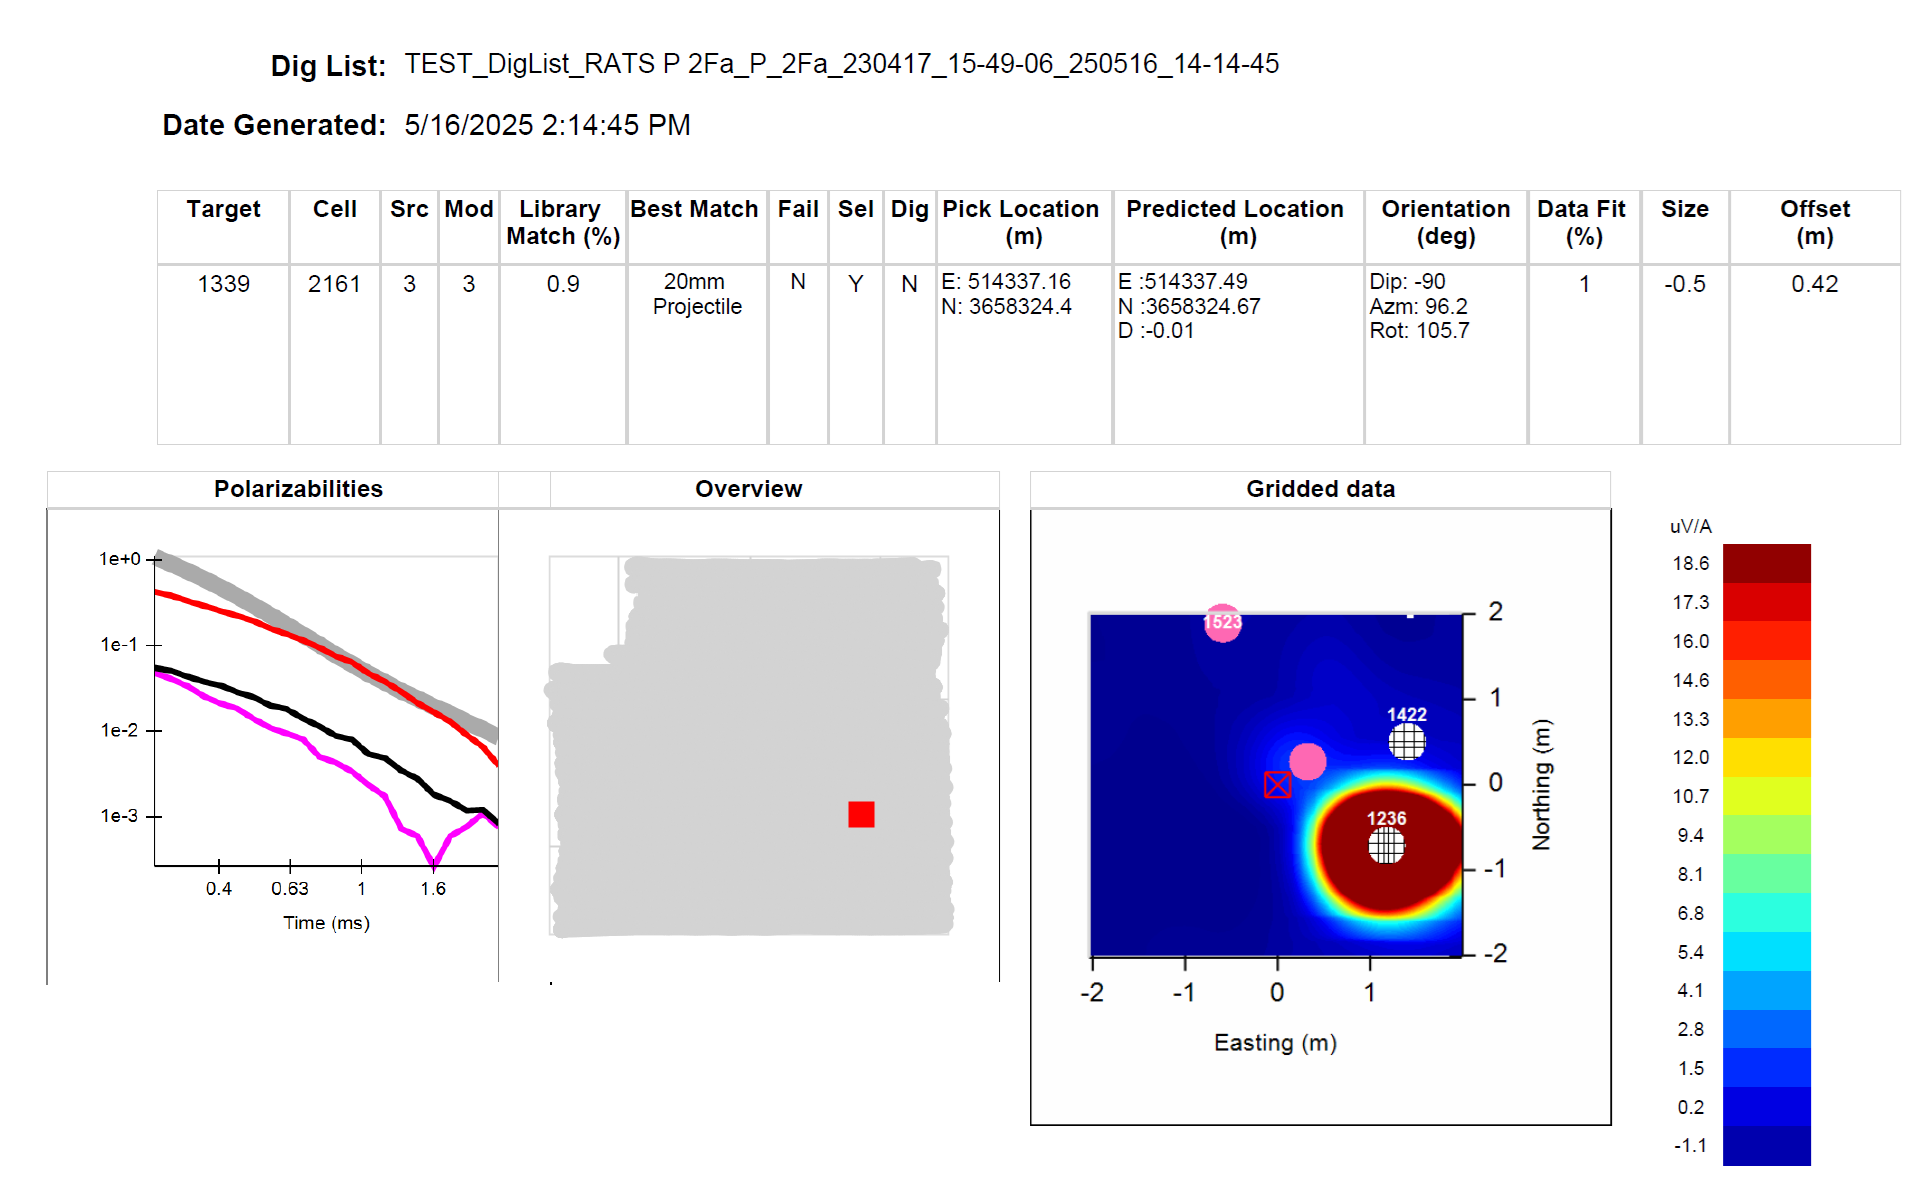
The example below shows a new-style Decision Plot for a target classified as Dig:

A second page compares every model for the target’s cell against the library, showing each model’s match confidence and best-matching library item (the selected model is highlighted):

Map marker key
The gridded panel uses the following markers for the target being decided and any nearby targets:
Here is an example of a Decision Plot for Target 1243, with Dig status = Y. In the gridded data it shows the predicted dig location for the target (white circle with black hatch marks). It also shows two non-dig locations from nearby targets (pink circles with the associated target number inside).
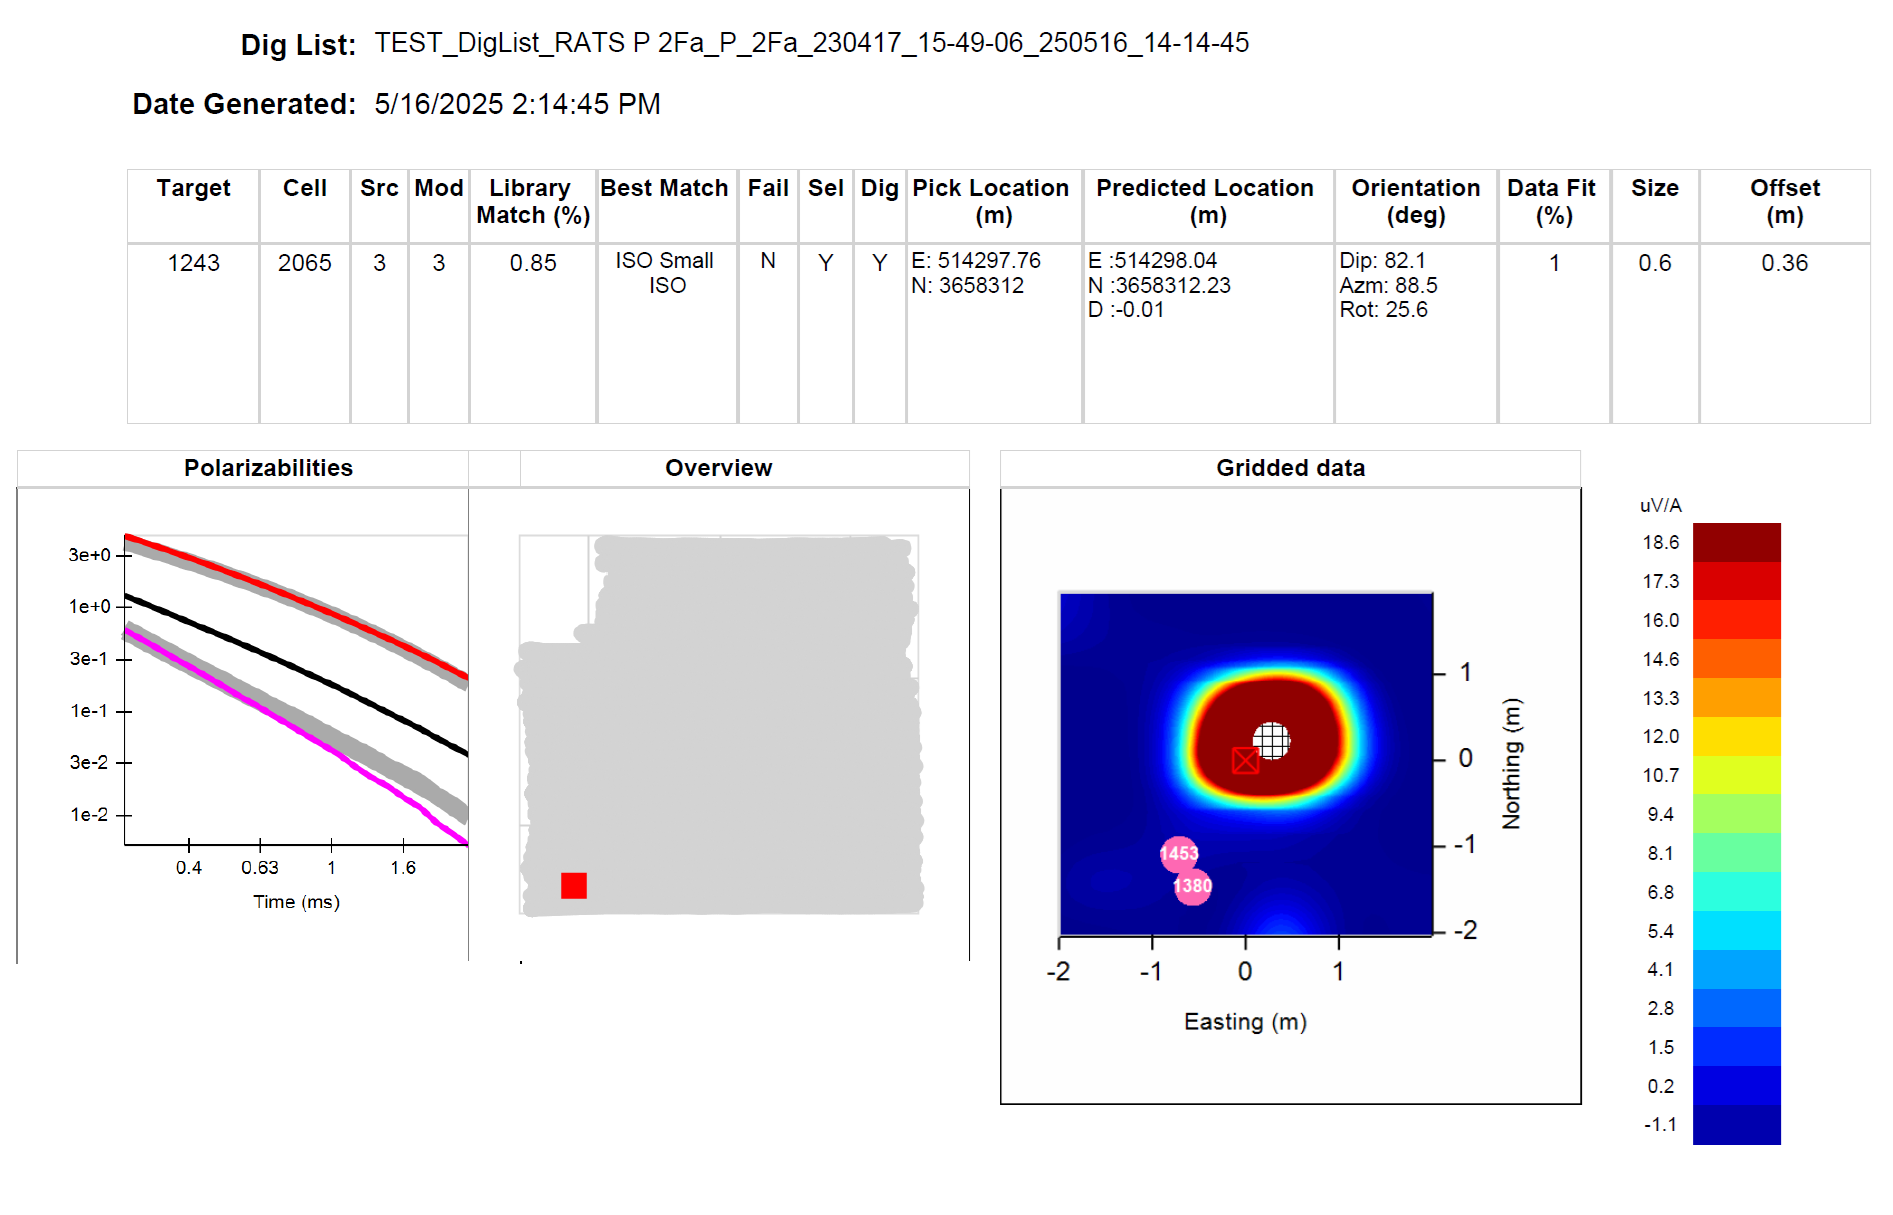
Here is another example for Target 1339, with Dig status = N. In the gridded data it shows the non-dig predicted location for the target (pink circle only). It also shows another non-dig location from a nearby target (also a pink circle, but with the associated target number inside). It also shows two other dig locations from nearby targets (white circles with black hatch, and with associated target numbers).