Summary
This document describes how to setup and run BTField’s Informed Source Selection (ISS).
Pre-requisites
Introduction
Workflows are accessed through the ‘ISS’ tab.
The ISS workflow is set up as three steps. Each step can set the status of a source.
-
Fail ⬤
- A step that is typically used to eliminate spurious models. For example, sources at boundaries and inversions with low data fit values.
-
Select ⬤
- A screening step. For example, used to identify sources with a size greater than some threshold size
-
Unselect ⬤
- A step used to apply criteria to unselect sources. For example, merging nearby targets, or unselecting sources with a poor match to library polarizabilities.
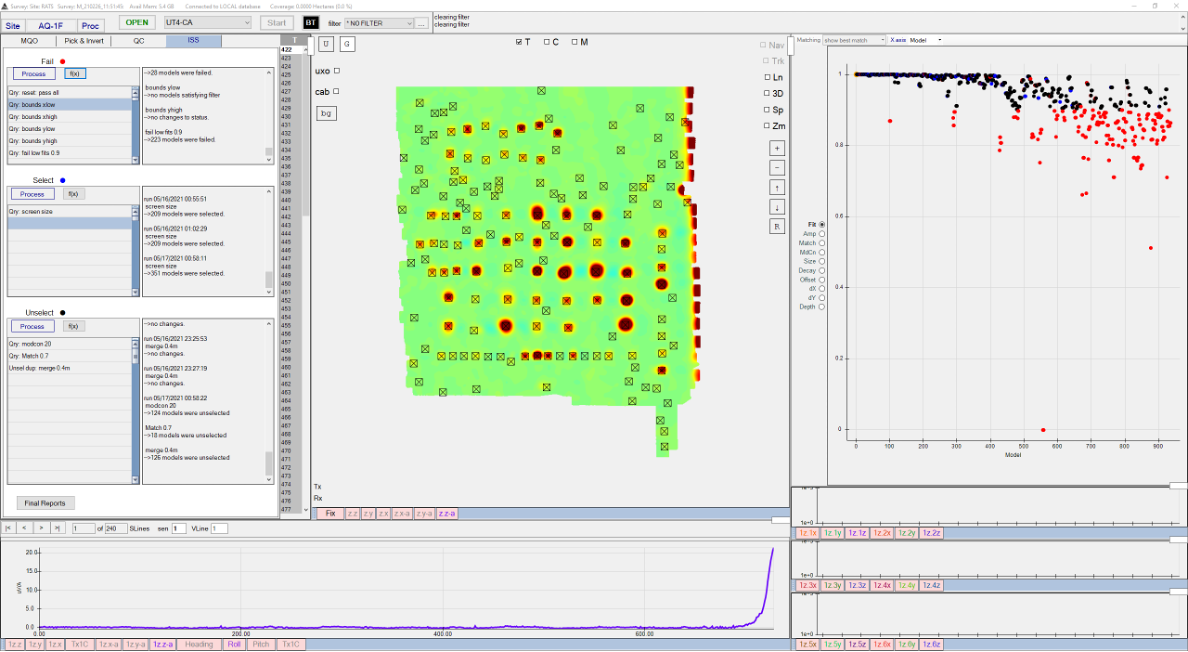
Setting up workflow Qry functions
The workflows are defined as a series of Qry functions.
-
A Qry function can be added by clicking on the f(x) button. This will bring up the Drag & Drop Functions window. The Qry functions are in the Filters dropdown.
-
Once the Qry is added to a flow, a Qry function window will be opened to select an available Qry function in the Cfg dropdown, or a new function can be defined.
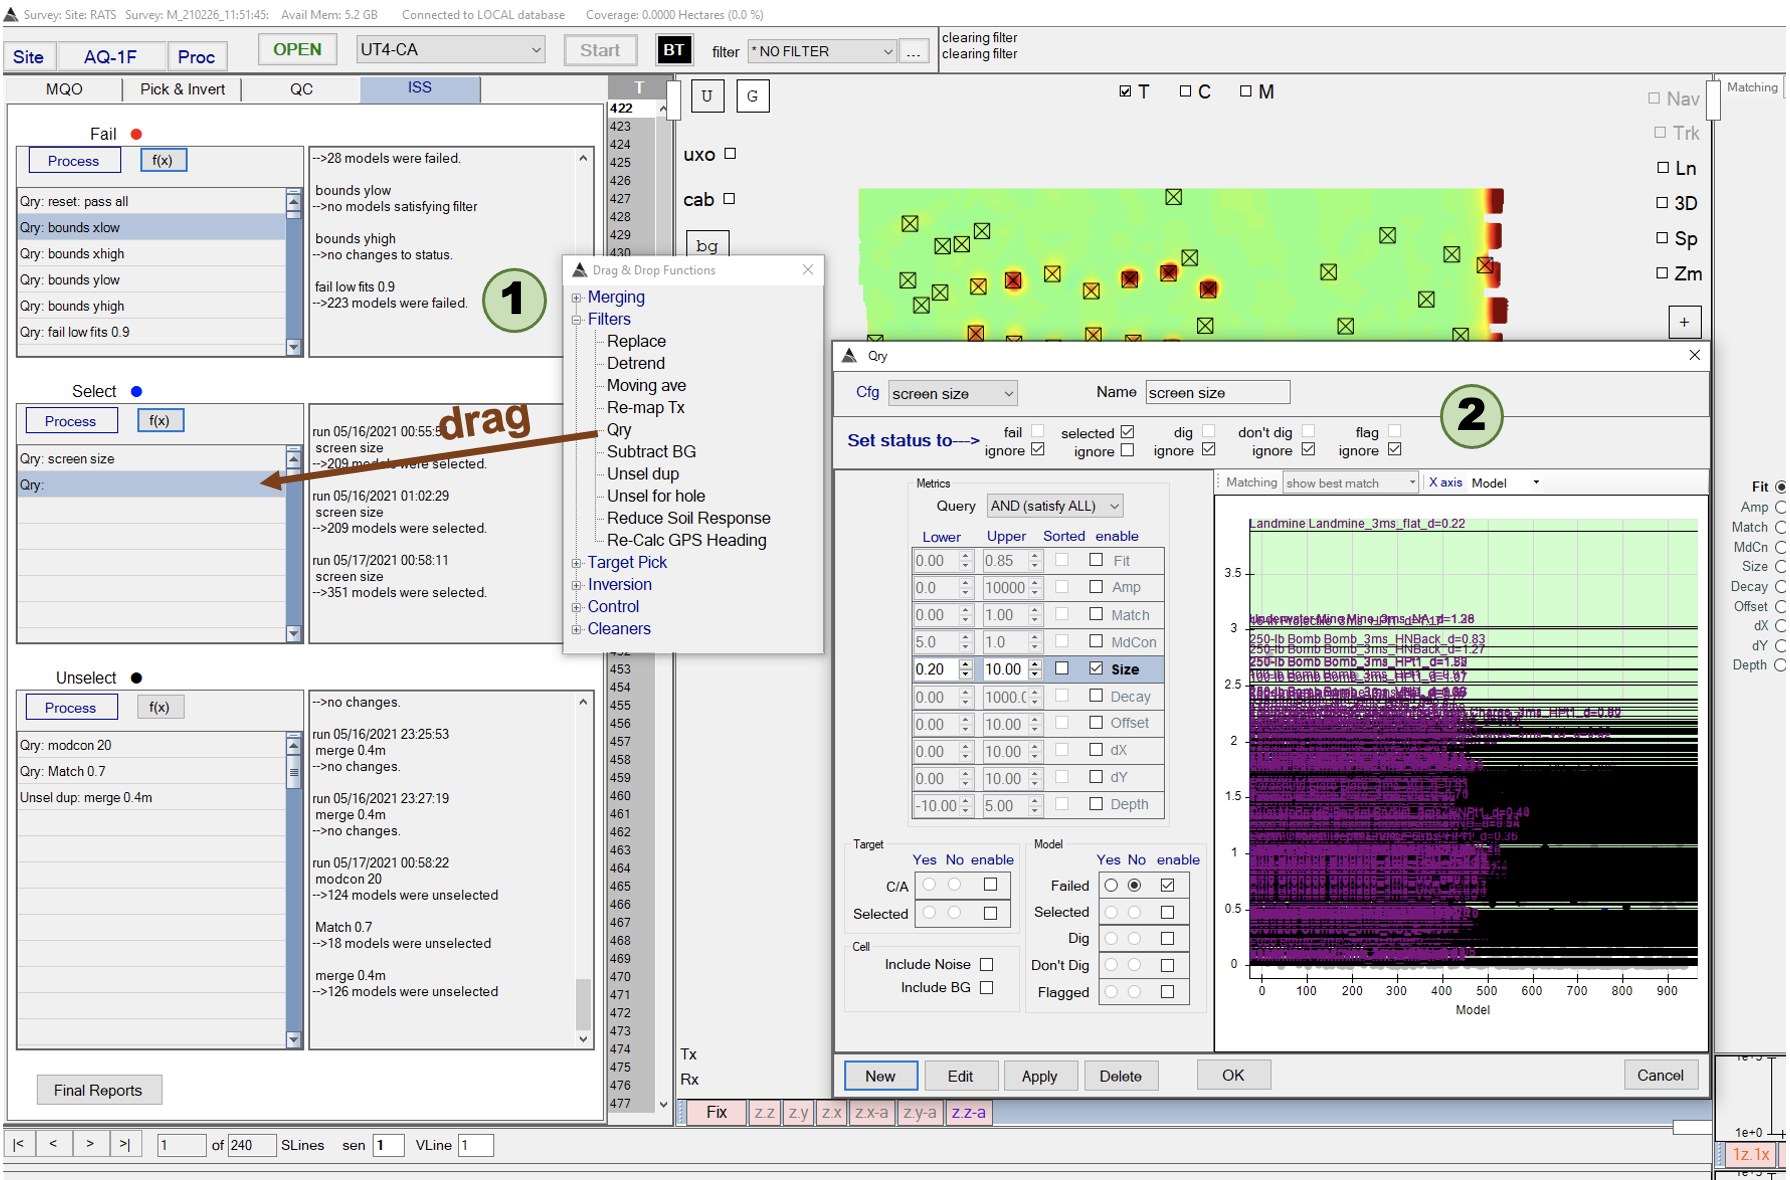
ISS setup.
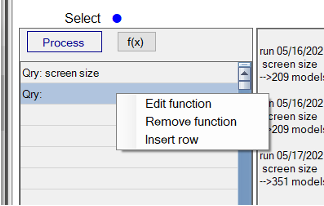
Note: The Qry function interface is also started when you right click on the Qry function and select Edit function.
Typical Fail functions
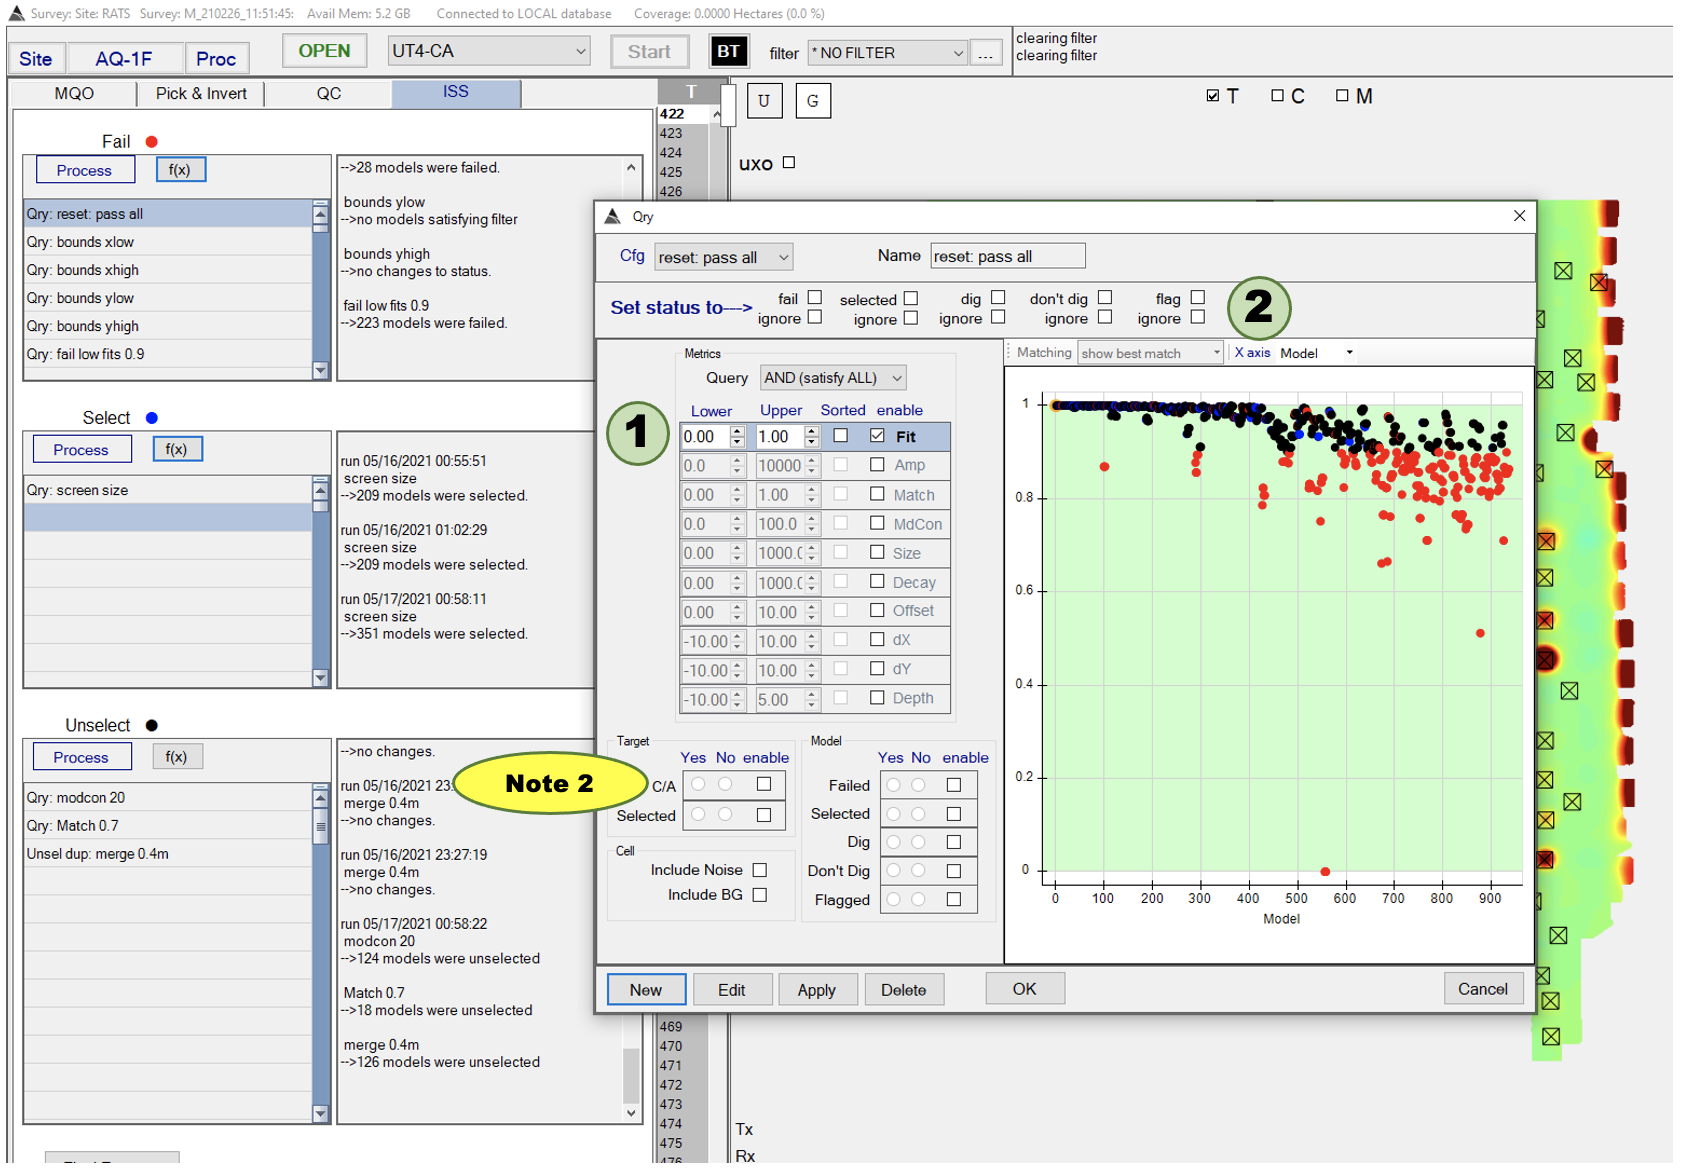
Passing all sources
- The ISS should always start with a function that resets all decisions, by setting each source to a Pass status.
- In this example, the Qry: reset: pass all Qry function does this:
- Identify sources with the Fit between 0.00 and 1.00 - i.e, all the sources – and
- Set the Set status to ⟶ flags to empty.
Fail sources based on proximity to inversion bounds
- We want to set identify sources that are near the spatial (i.e. x,y, depth) inversion bounds.
- In this example, we look for sources within 1 cm of the x inversion boundary at x = -1.0 m
- Find sources with the “dX” between 10.00 and -0.99.
- Setting the Set status to ⟶ flags such that the sources against the boundary are failed, and other status flags are ignored.
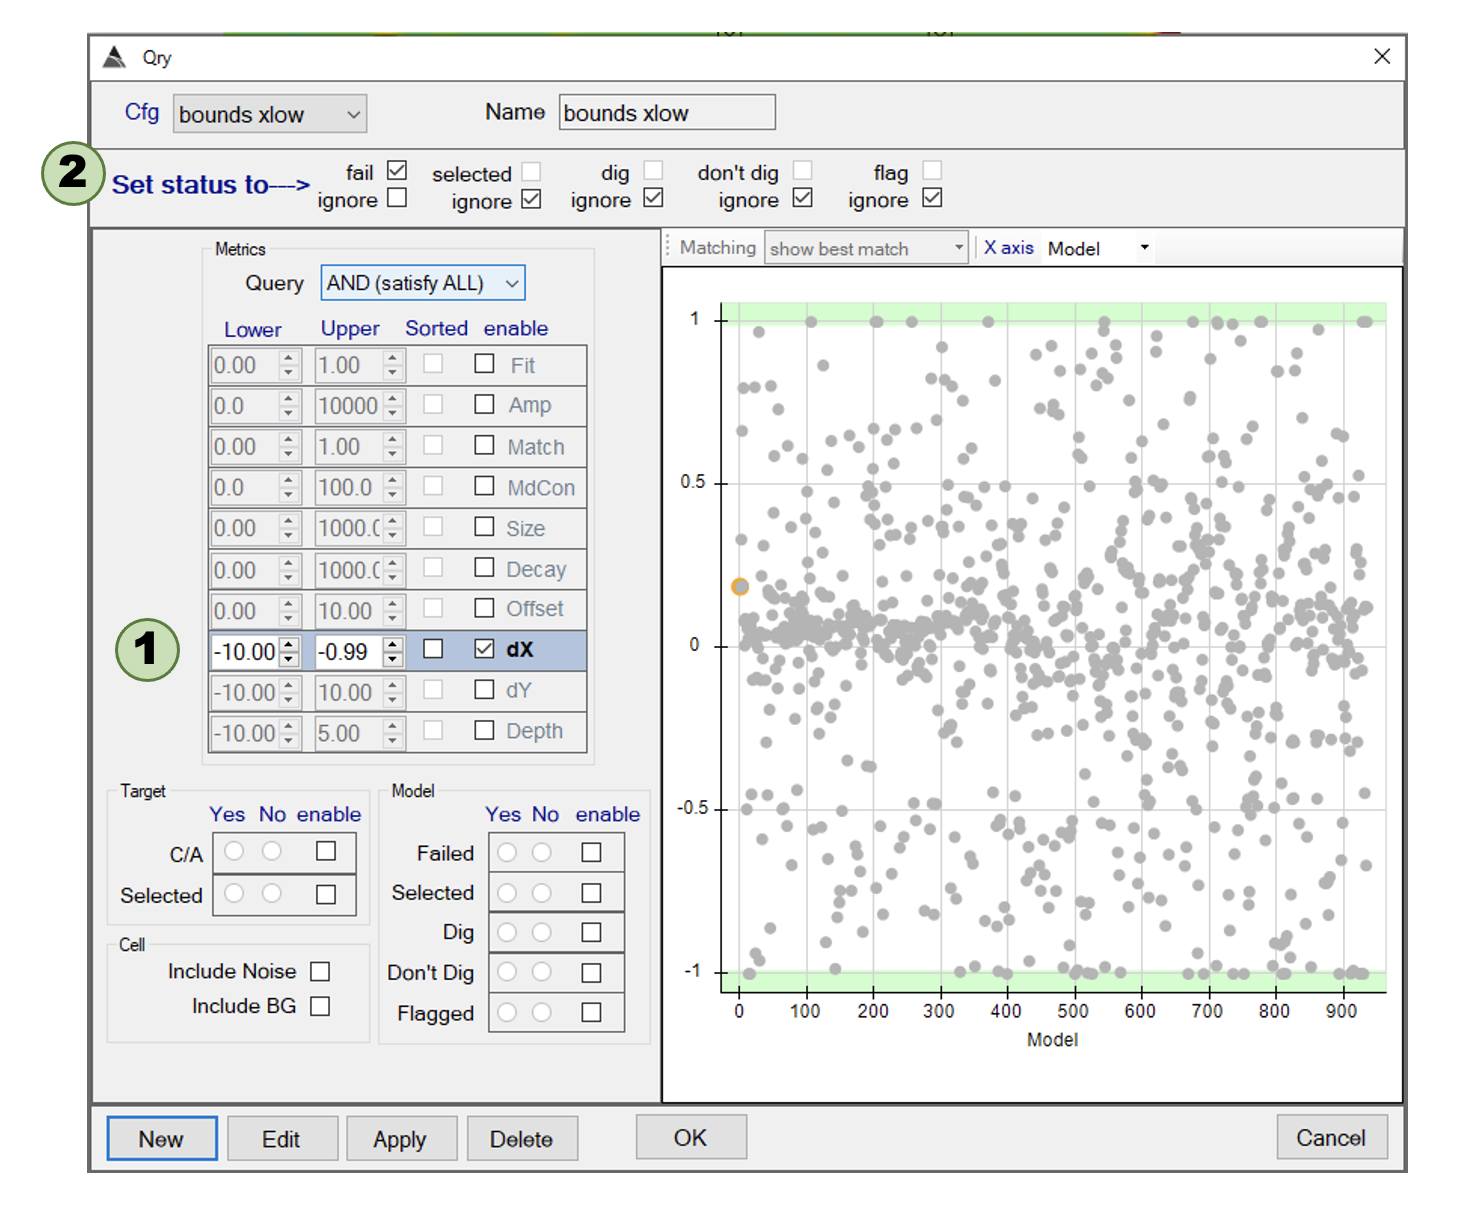
Qry setup.
Fail sources with poor fits to the data
- Want to eliminate sources that were estimated from an inversion with a poor data fit.
- In this example, we look will fail sources with inversions that have a Fit value less than 0.9.
- Find sources with the “Fit” between 0.00 and 0.90.
- Set the Set status to ⟶ flags such that the sources are failed, and other status flags are ignored.
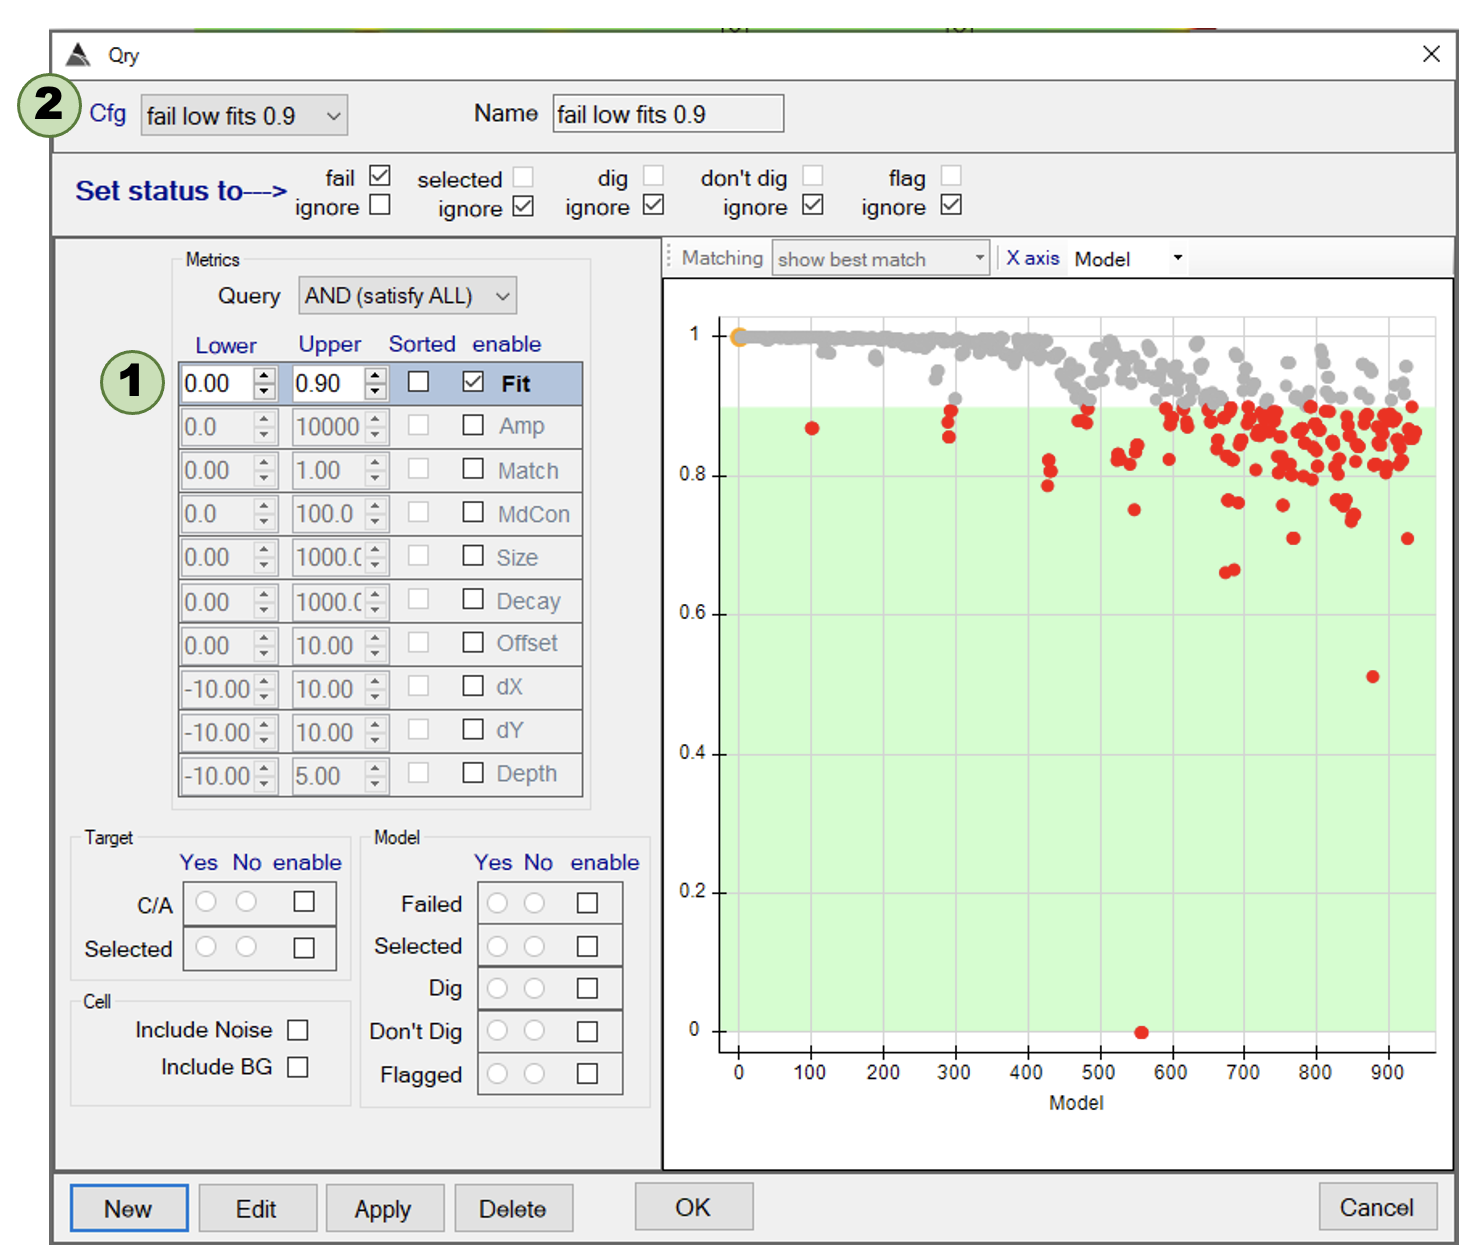
Qry setup.
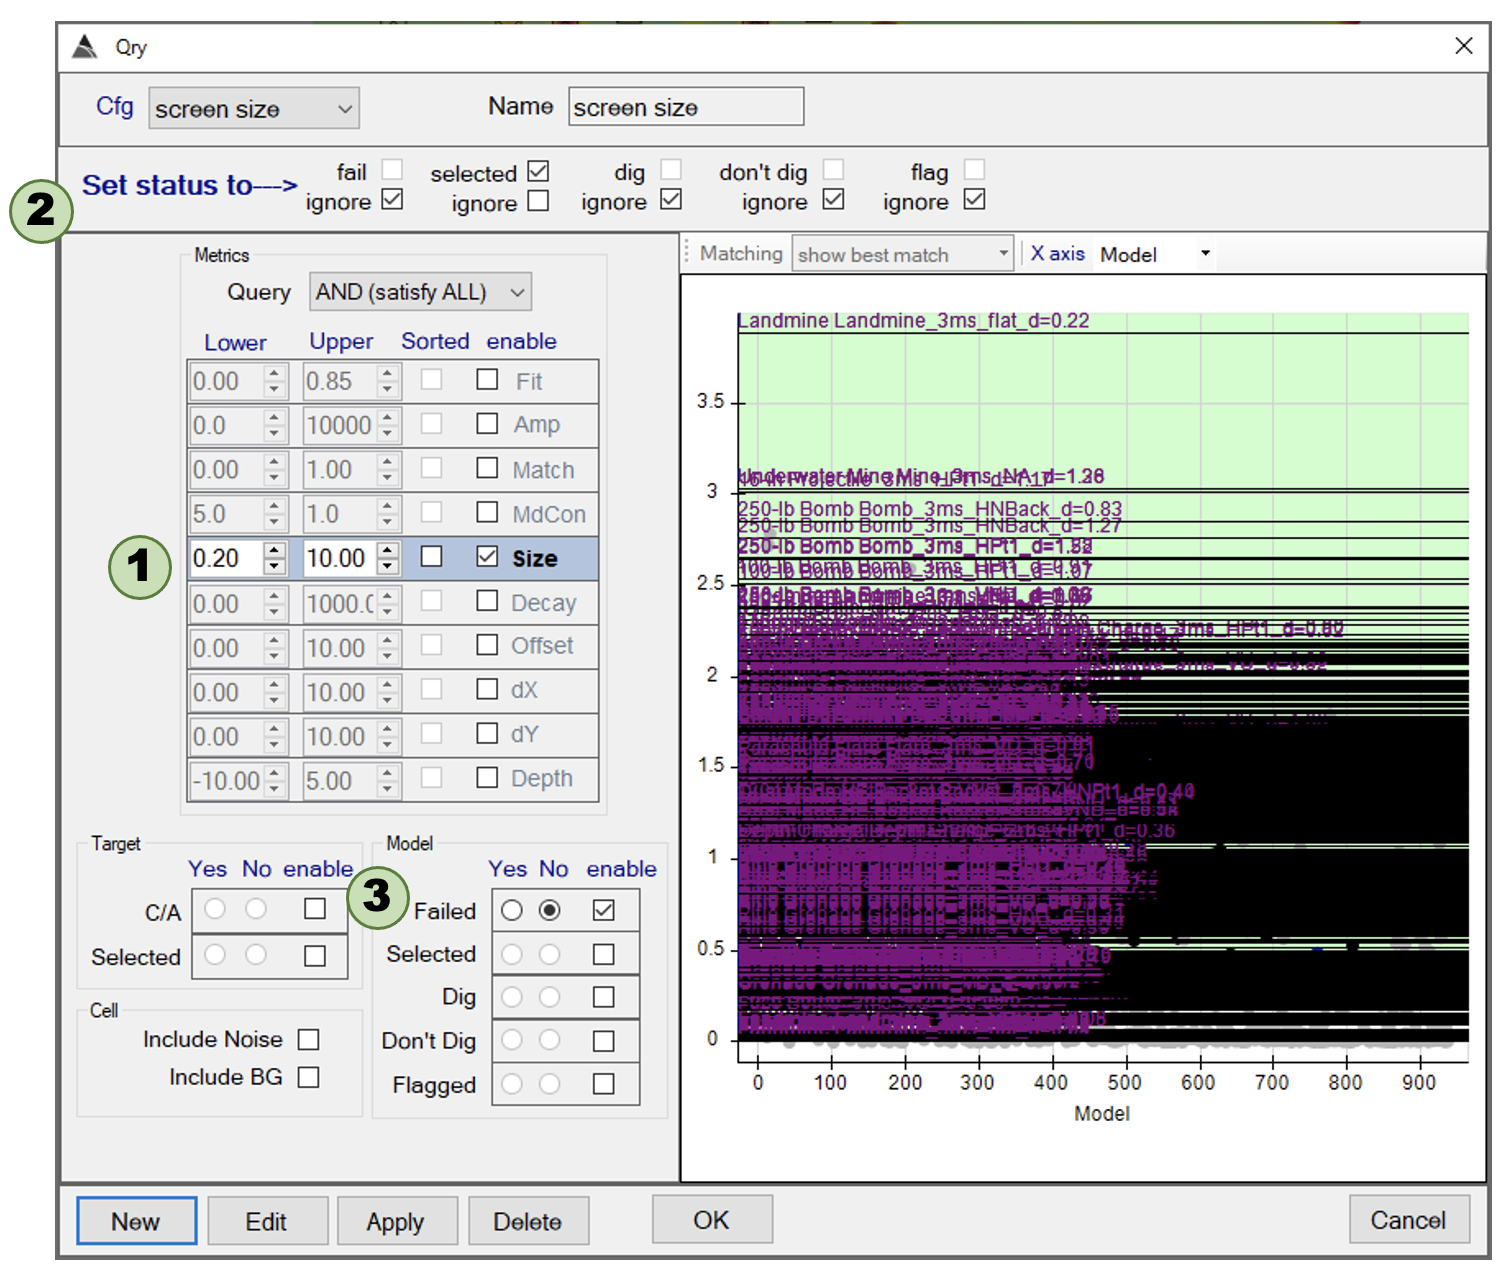
Select Sources Using Size
- Want to select sources that aren’t smaller than the size threshold.
- In this example, we look will select sources with a Size parameter greater than 0.2
- Find sources with the Size between 0.2 and 10.00. 10 is selected since its larger than the largest size value in the dataset.
- Set the Set status to ⟶ flags such that the sources are selected, and other status flags are ignored.
- We only want to select sources from models that are passed. Therefore, in the Model box, enable the Failed status, and select the No radio button. In this way, only sources that have not been failed will be assigned a Selected status.
Note: In the Metrics panel to the right, the size values for targets in the library will be plotted. For this example, the DoD library is being used. The large number of black lines indicating size obscures the values of the sources.
Notes about size calculations
BTField calculation
BTField uses the first 5 time channels specified in the inversion mask. Let \(\bar{L}_{n}\) denote the vector of mean values of any vector \(\overrightarrow{L}_{n}\). Where \({n}\) indicates one of the \({N}\) principal polarizability vectors. Depending on the pol matching mode, \({N}\) may be 1 or 3 for L1 or L123 match. Then,
\[Size = \log _{10} (\sqrt{ \sum_{n=1}^{N} \bar{L}_{n}^2 } + 1.0)\]UXOLab calculation
UXOLab has several configurable options for computing size. The average or mean of the vector can be changed to median. Library scaling of pols must be taken into account if comparing UXOLab size to BTField size. Additionally the range of inverted time channels can be specified as any sequential subset of times from the inversion. Be sure to consider these options before making any sort of comparison.
Let \(\bar{L}_{n}\) denote the vector of mean values of any vector \(\overrightarrow{L}_{n}\). Where \({n}\) indicates one of the 3 principal polarizability vectors.
\[Size = \log _{10} ( \max(1e^{-10}, \dfrac{\sqrt{ \sum_{n=1}^{N} \bar{L}_{n}^2 }}{10}) )\]Unselect sources
Unselect poor matches to a library
- We might want to unselect poor matches to a library:
- If we are confident in the ability for the data to get reasonable matches to a library.
- If the library represents all possible TOI.
- In this example, we want to remove from consideration sources that has a fit match to the library that is less than 0.7.
- Find sources with the Match between 0.00 and 0.7.
- Set the Set status to ⟶ flags such that the selected box is not checked, and other status flags are ignored.
- In the Model box, enable the Selected status, and select the “Yes” radio button. In this way, only sources that are selected, will be unselected.
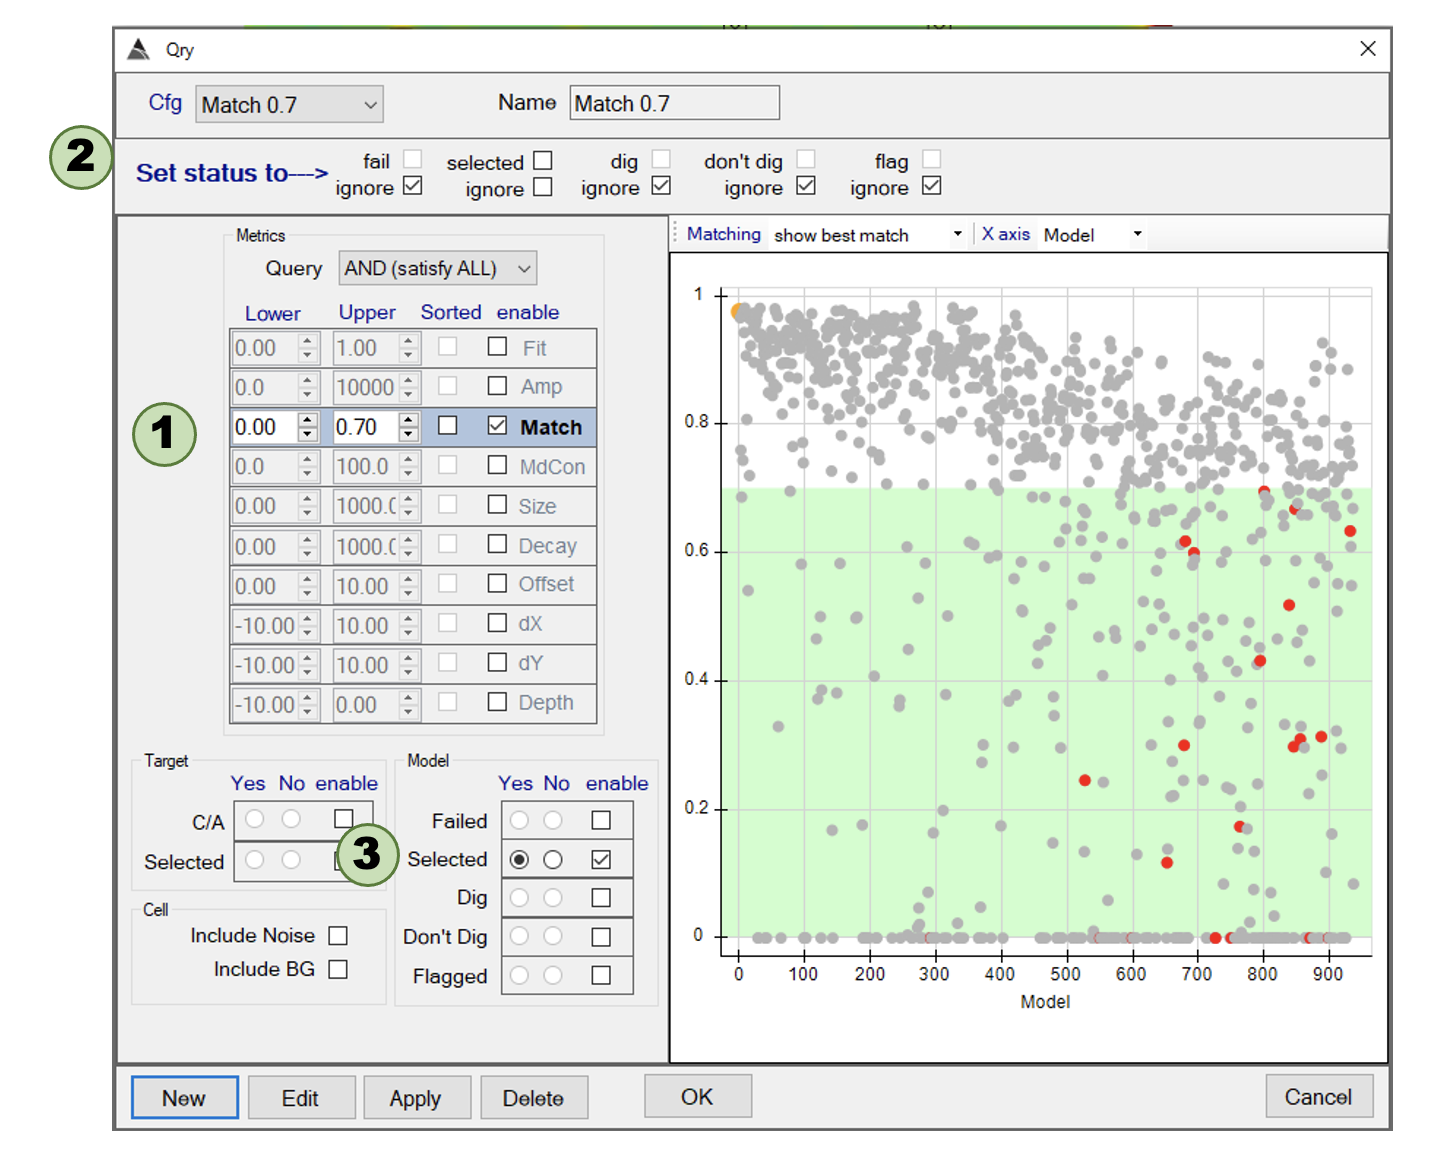
Qry setup.
Unselect sources with low Model Contribution
- Sources that don’t contribute appreciably to the data are sometimes spurious and/or not significant.
- In this example, we want to unselect sources that contribute less than 20% to the data.
- Find sources with “MdCon” between 0.0 and 20.0.
- Set the Set status to ⟶ flags such that the selected box is not checked, and other status flags are ignored.
- In the Model box, enable the Selected status, and select the Yes radio button. In this way, only sources that are selected, will be unselected.
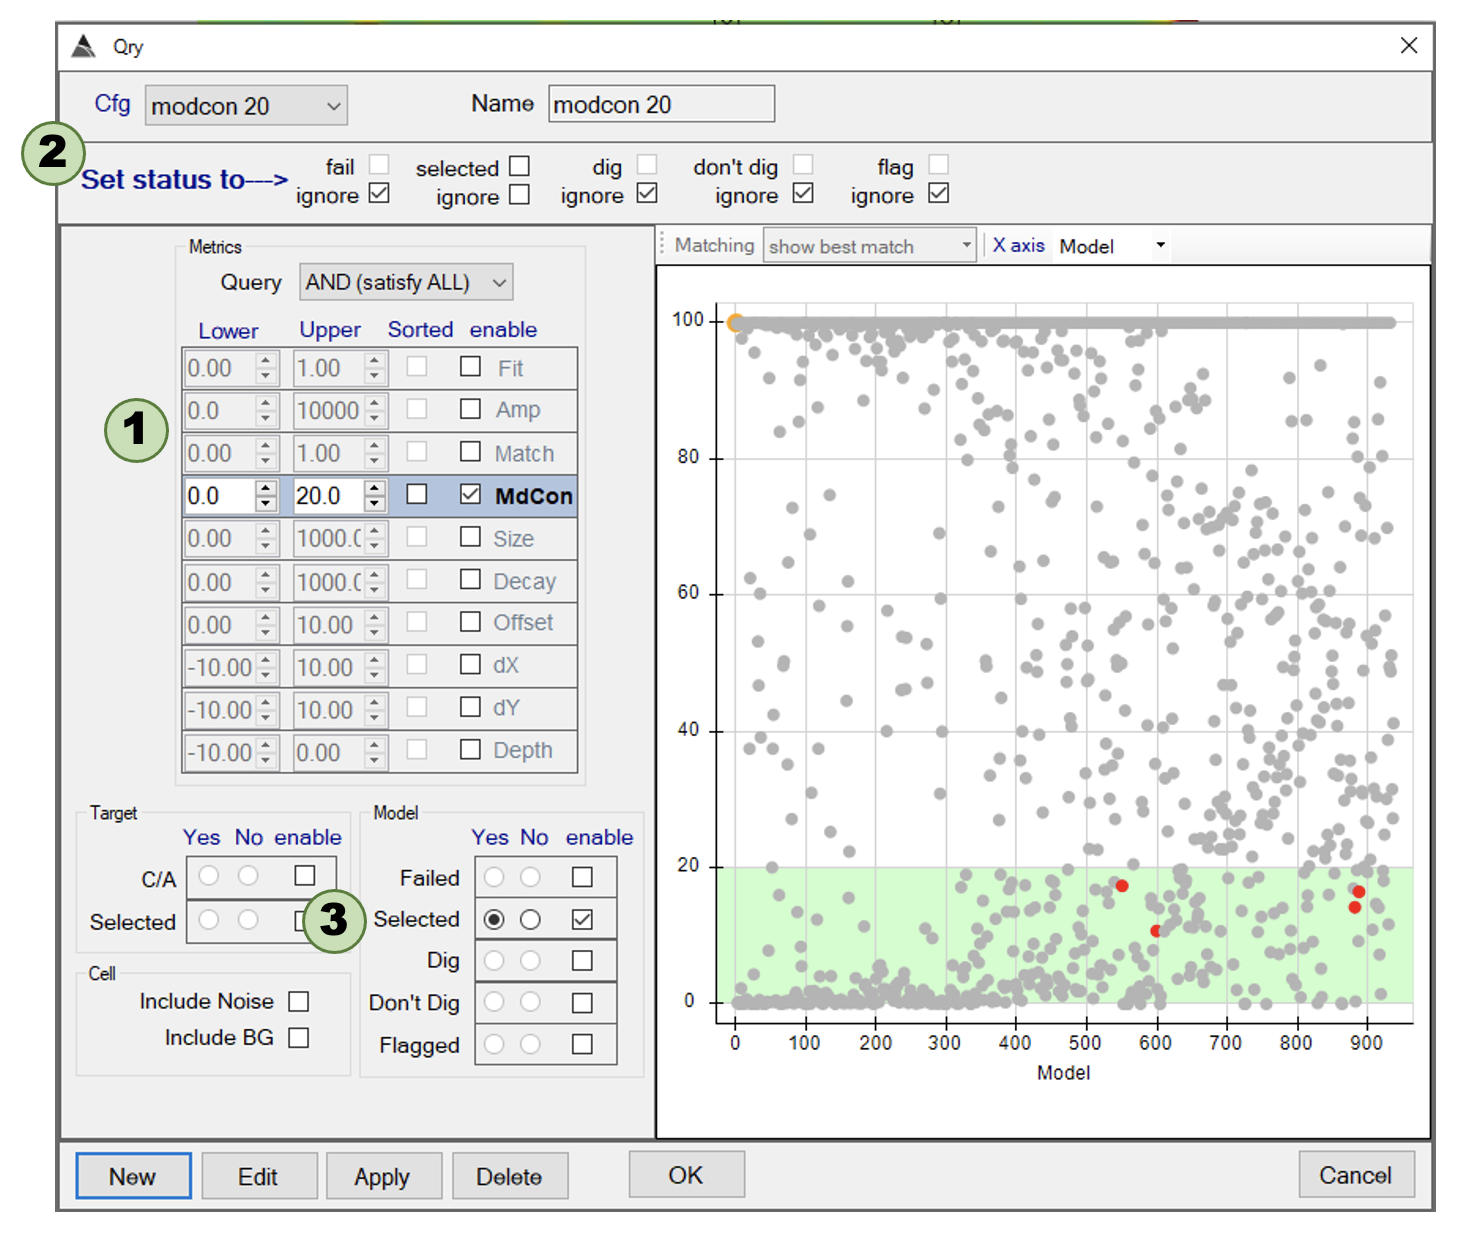
Qry setup.
Merging sources
- Merging sources isn’t achieved through a Qry function, but rather the Unsel dup function
-
Similarity of sources and separation are used determine the merging.
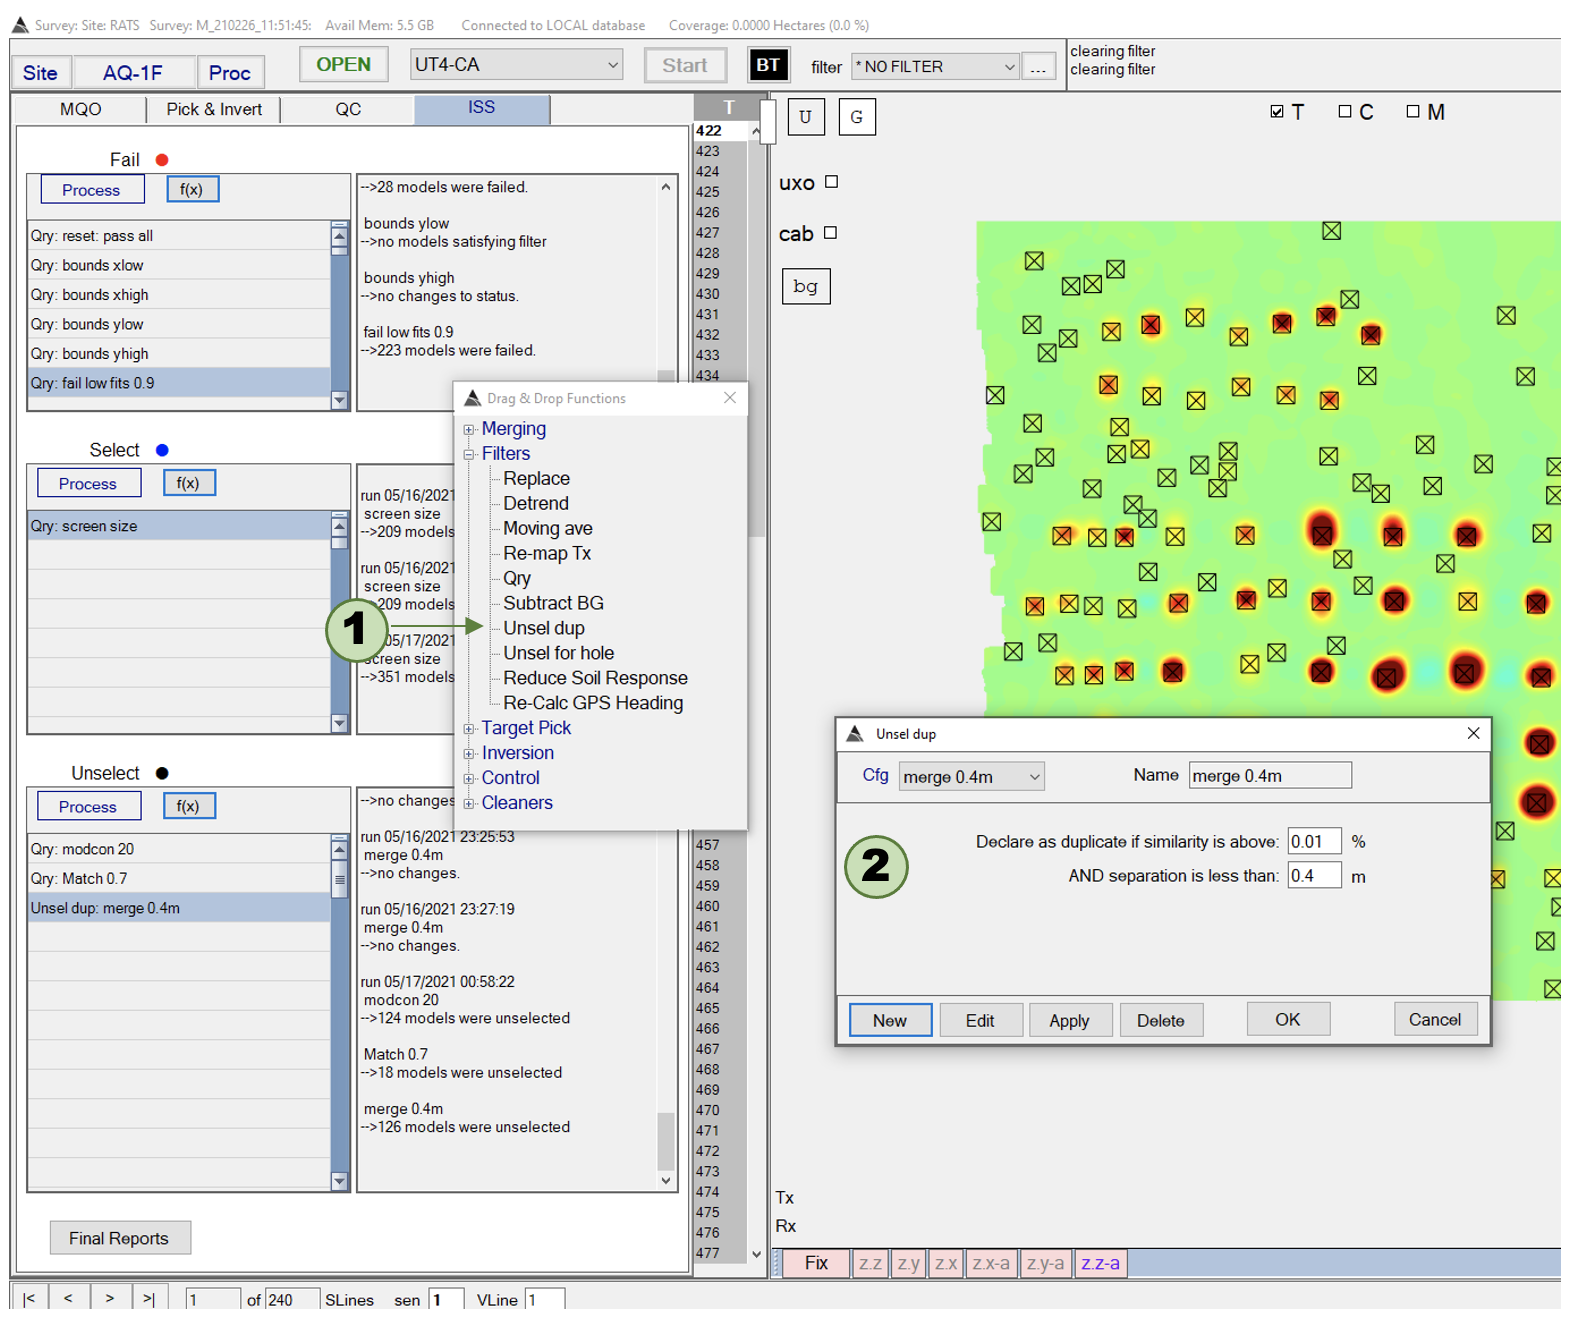
Qry setup.
Executing the workflow
- To run the ISS, click the Fail, Select and Unselect Process buttons in succession.
-
The symbols in the Metrics Navigator view (panel at right) will by coloured according to their Fail ⬤, Select ⬤ and Unselect ⬤ status.
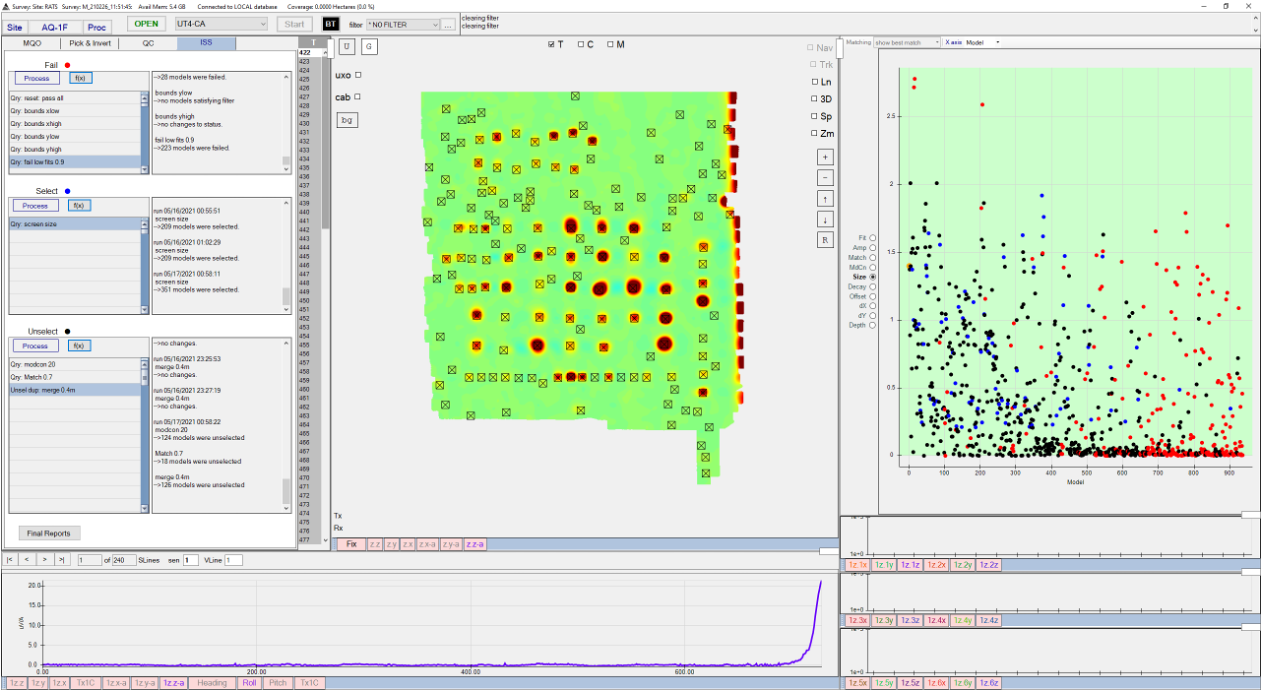
QC decisions
- The Metrics Navigator view can be used to review the ISS results.
-
Clicking on a point will result in the Target being highlighted in the gridded data. The corresponding polarizabilities and metrics can viewed by clicking on the QC tab.
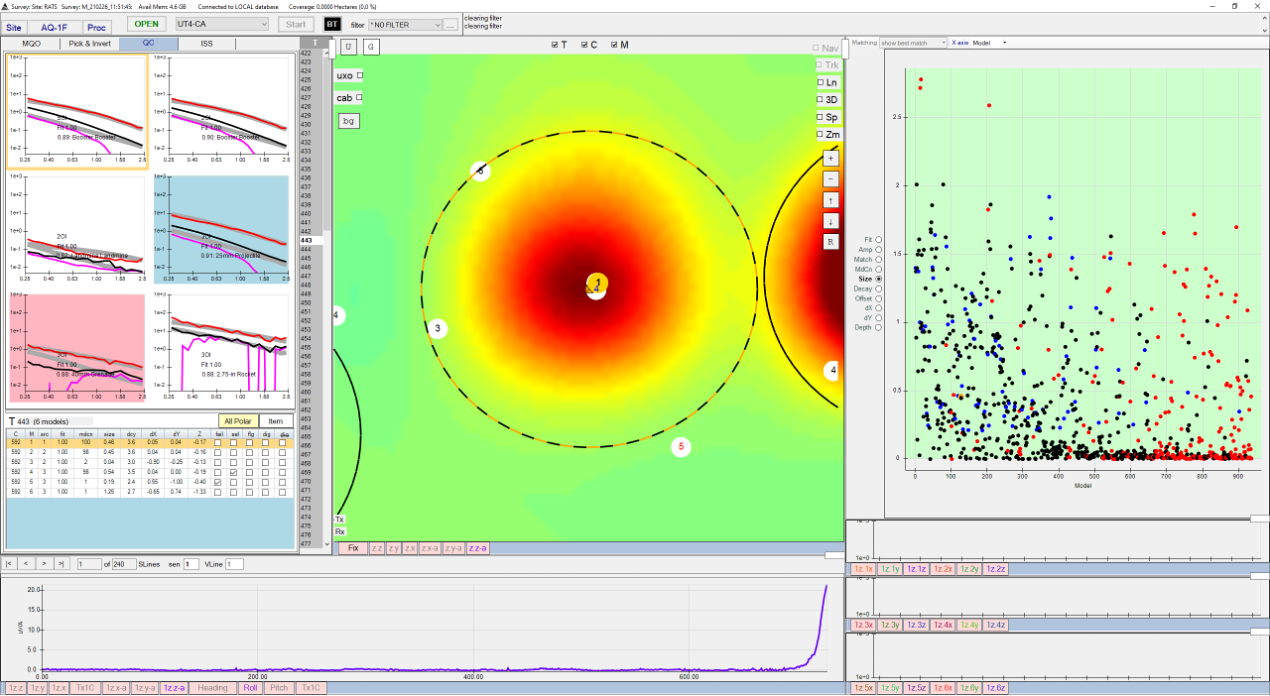
Metrics Navigator.
Exporting a cued target list
- To run export a target list, click on the Final Reports button at the bottom of the ISS tab view.
- A filter can be selected in the dropdown menu to determine what type of information is being exported. Choosing Selected will only output the sources that will be cued.
-
An ASCII Report or a more graphics based report can be selected for output. The ASCII Report is formatted to be loaded into Excel.
Note: we are currently modifying the look and formatting of these reports.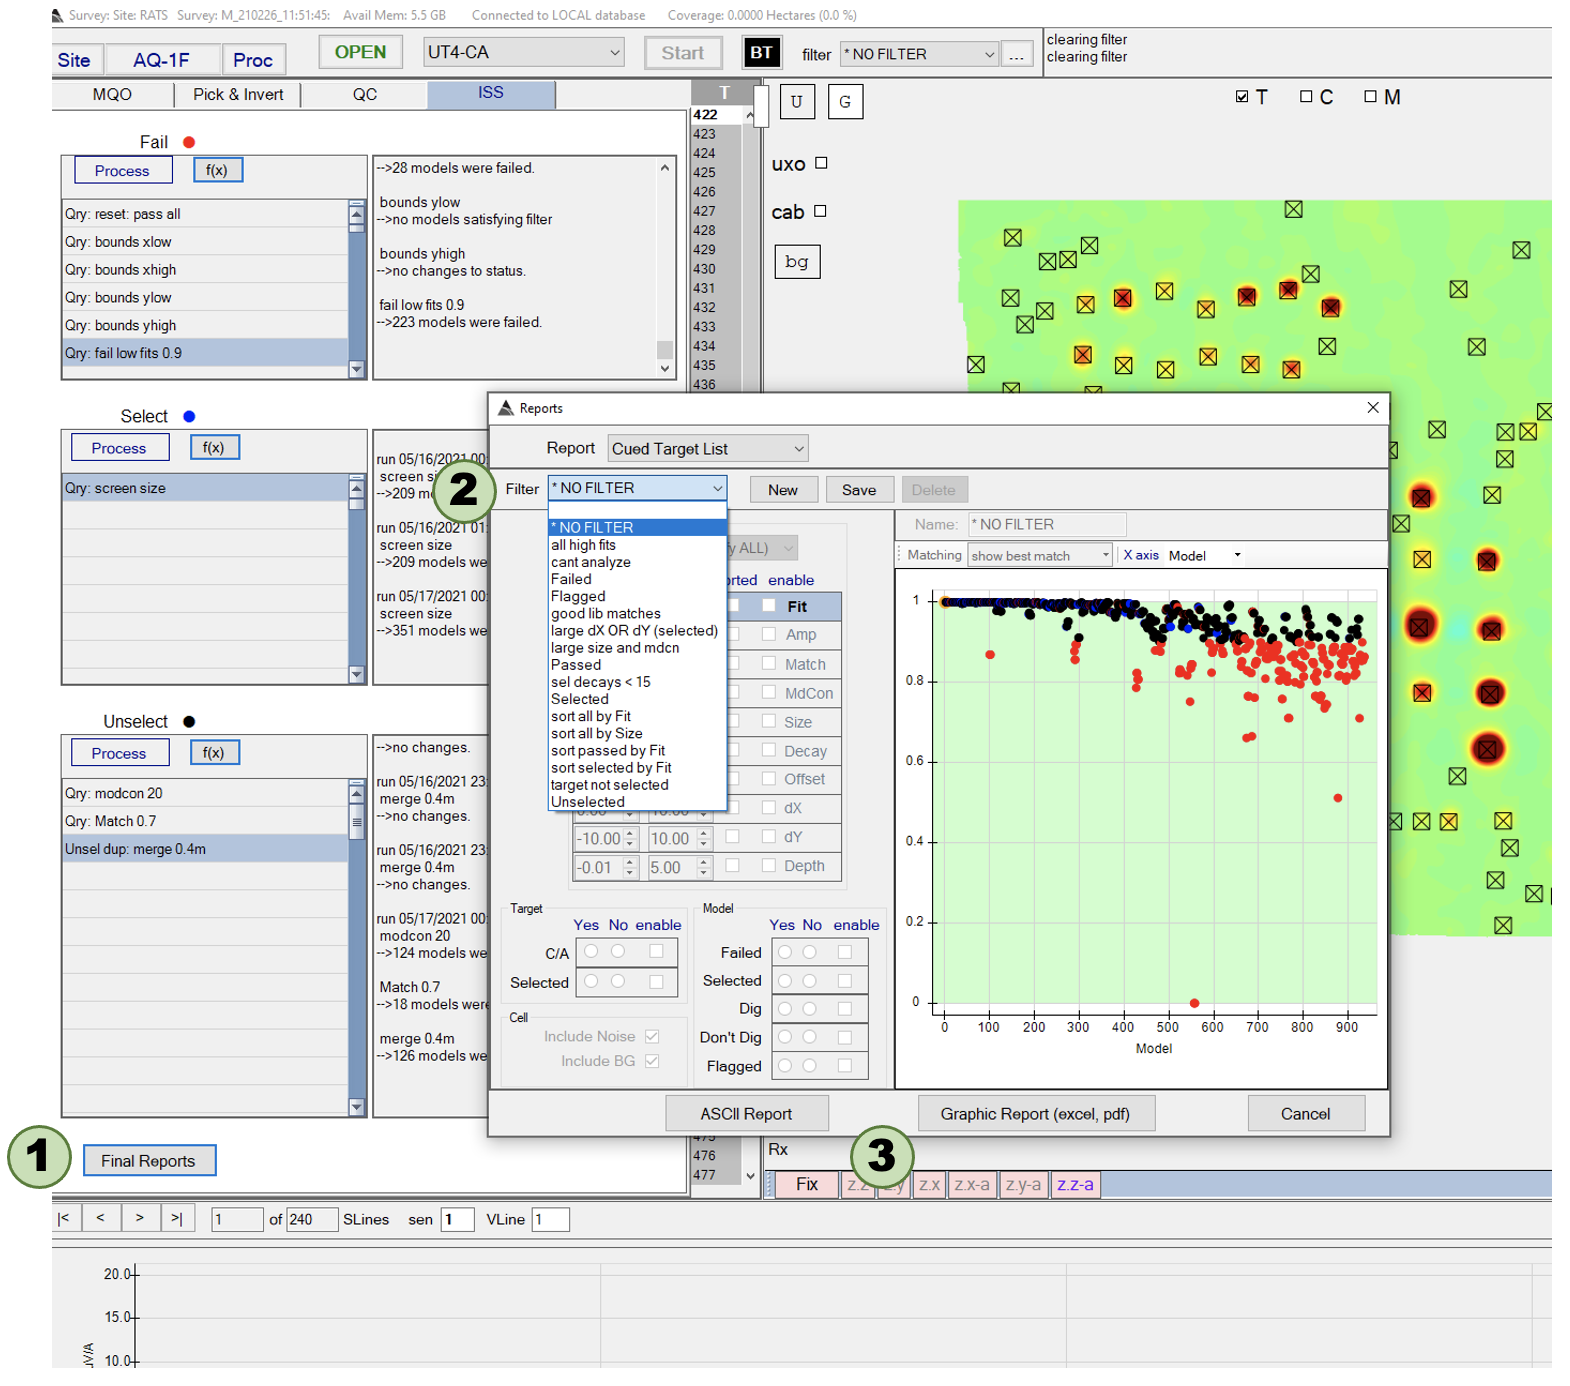
Reports dialog. -
By default, the current version of the list includes the polarizabilities. Future versions of the list will have an option to not include the polarizabilities.
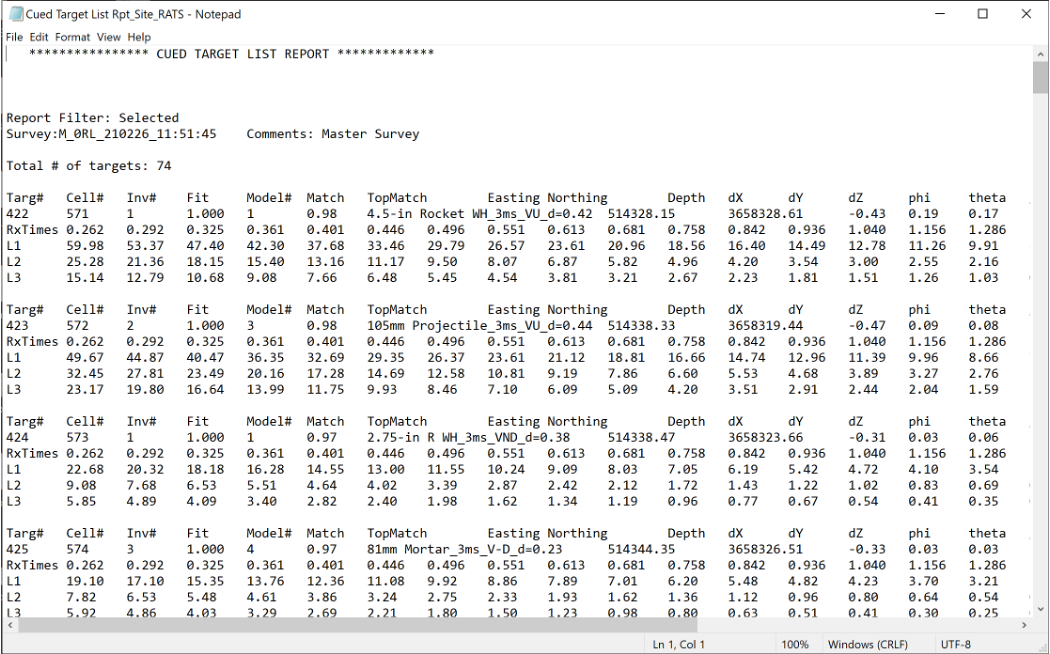
Example report.