Summary
This document provides a recommended procedure for determining and applying a lag correction to positional data in BTField. This is not typically required with UltraTEM data collected with RTK GPS, but may be necessary when Stencil SLAM positioning is used. In this case, there can be an offset between the clocks for UltraTEM and Stencil data streams, and this offset must be corrected in the data.
Steps
- Import an IVS survey with two passes in opposite directions over IVS seedsand run the default P Flow 1 to merge and filter the data.
-
Configure the gridded image view to show “Gridded Points” only.
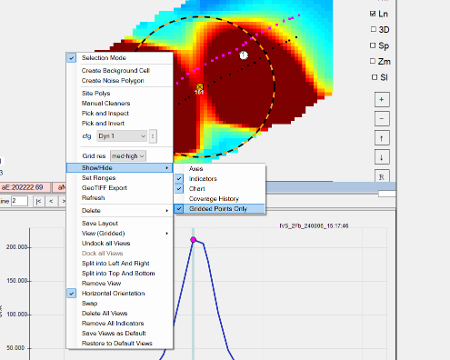
Configuring the gridded image. -
Now configure the grid to use only one z-component measurement for a single receiver (e.g. as shown below). Right click on the indicator for the gridded image and then set the Tx-Rx pairs. Gridding a single measurement allows you to easily switch between profiles for the two passes.
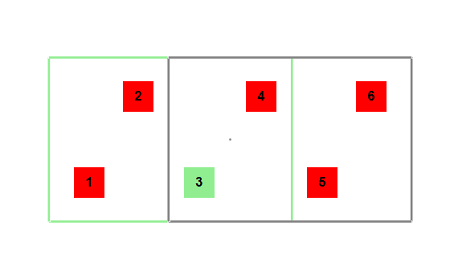
Select a single measurement for gridding. -
Display a Profile View below the gridded image so you can identify the peak of selected anomalies on each line. If no profile view is currently shown, right click in the Gridded Image window, select “Split into Top and Bottom” and then configure the new view to be a Profile view (Right click and then select “View-> Profile View”).
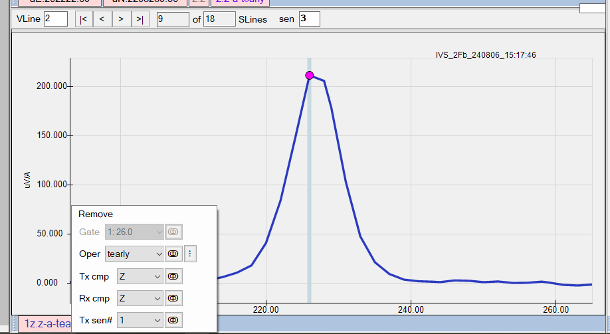
Display a Profile view showing the profile of selected measurements. - Identify the locations of peaks on adjacent lines by clicking on the grid and estimate the number of points separating the peaks.
- Determine a lag (in s) by taking half the number of points separating the peaks and multiplying by the sample rate of the UltraTEM. For example, if operating in 2Fb mode at 15Hz then each measurement (i.e transmitter-receiver combination) will be sampled every 0.1333 s. If the anomaly peaks are shifted in the direction of travel of the sensor, then a positive lag corection should required. A negative correction can be used if the shift is opposite the direction of travel.
-
Now insert a “Replace” function at the start of the P Flow and configure as shown below to apply your lag correction. After re-running the P Flow, you will see the peaks shift. Some iteration will be required in order to fine tune the required lag.
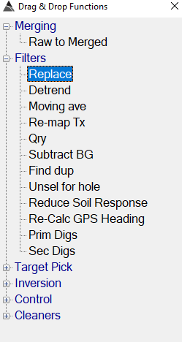
Drag a replace function to the start of the P Flow. 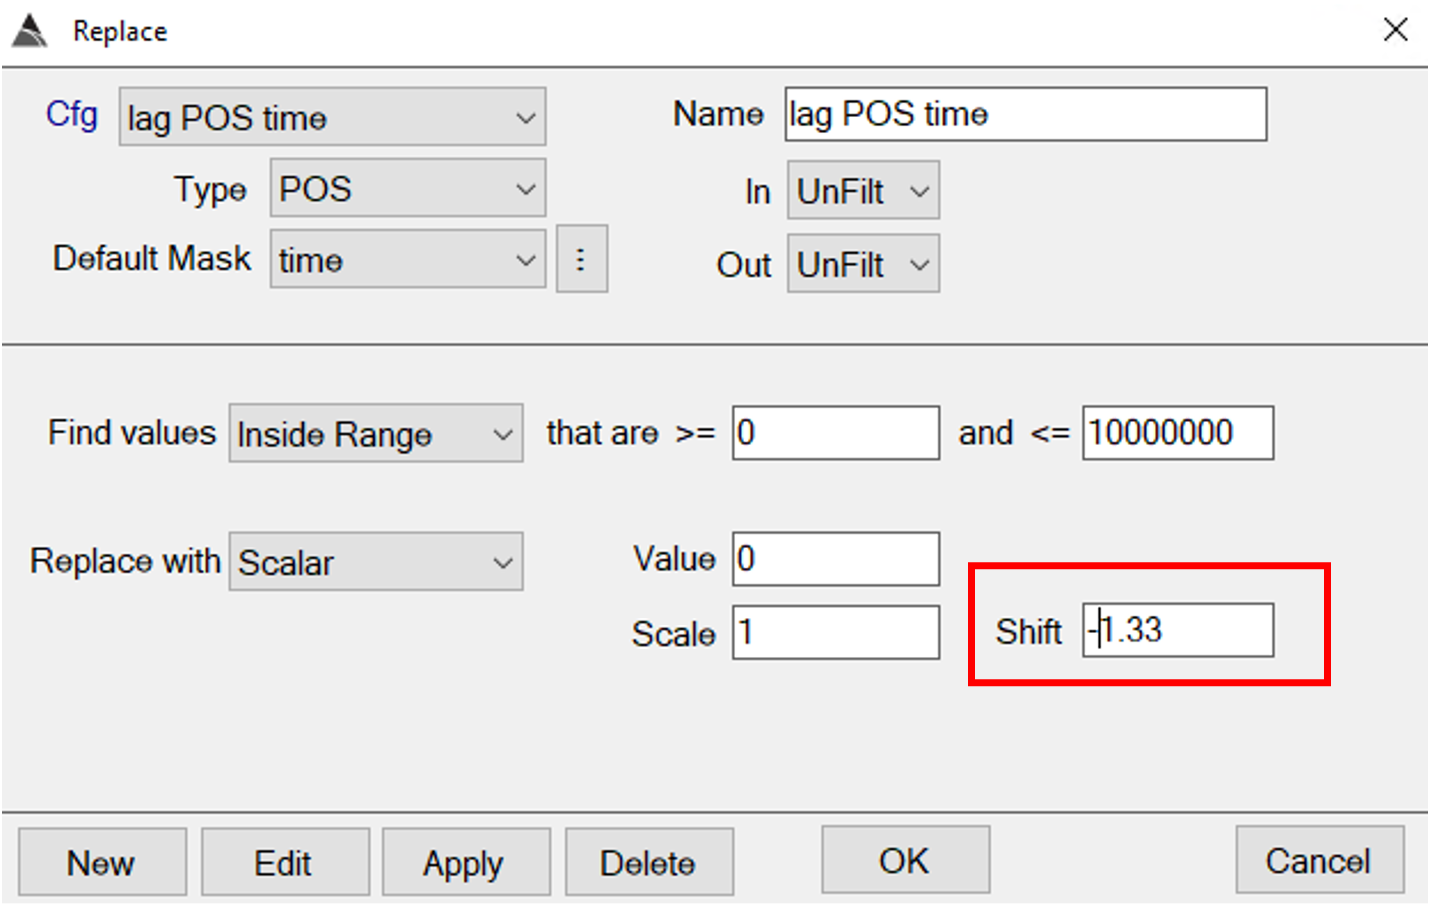
Configure the replace function with the required lag (highlighted in red). 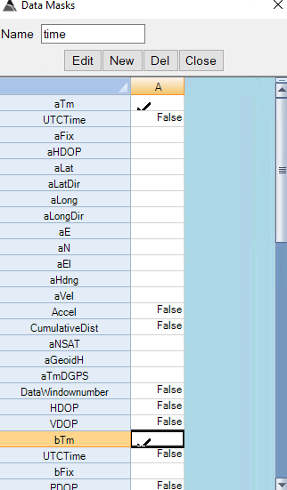
Configure the mask so that it applies to the times for both receiver banks. - Now process the IVS as normal and confirm that all relevant MQOs are met. The lag correction may be verified using another IVS (e.g. from the afternoon) if there have been no intervening restarts of the Stencil and UltraTEM.