Procedure
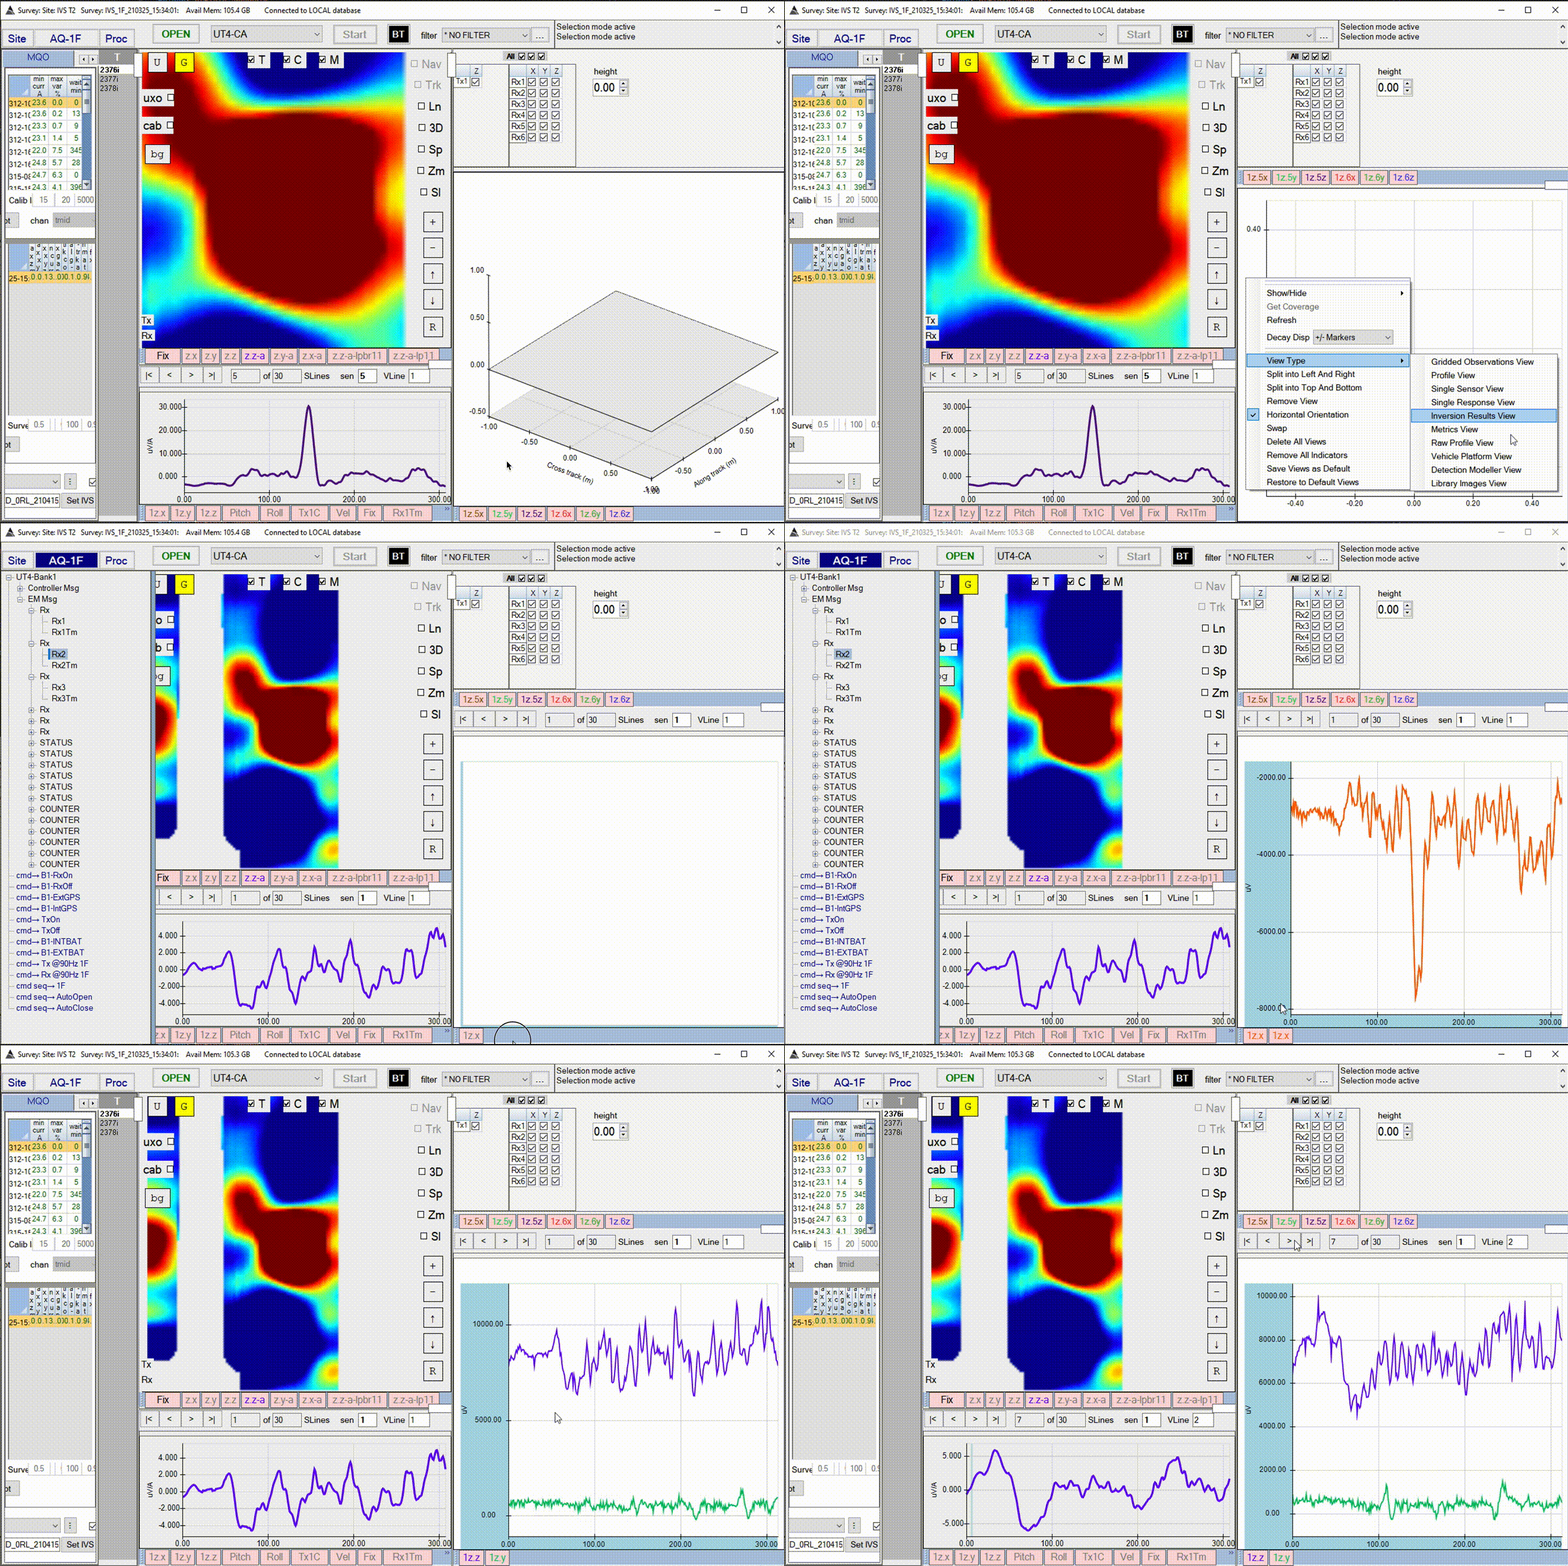
- (Optional) Create a new view panel for the RAW data view. Right-click on an existing view and select Split into Top and Bottom or Split into Left and Right.
- Right-click on the existing view and select View Type -> Raw Profile View. The Raw Profile View will now be empty and unconfigured.
- Configure the Raw view by dragging a Rx output from the Aquisition tab (AQ-1F) to the new view as seen in the figure below.

- Configure each tab to indicate the time and Tx/Rx combination you want. Toggle through both sen (Rx cubes) and VLine (vehicle lines) using the arrow buttons in the view.
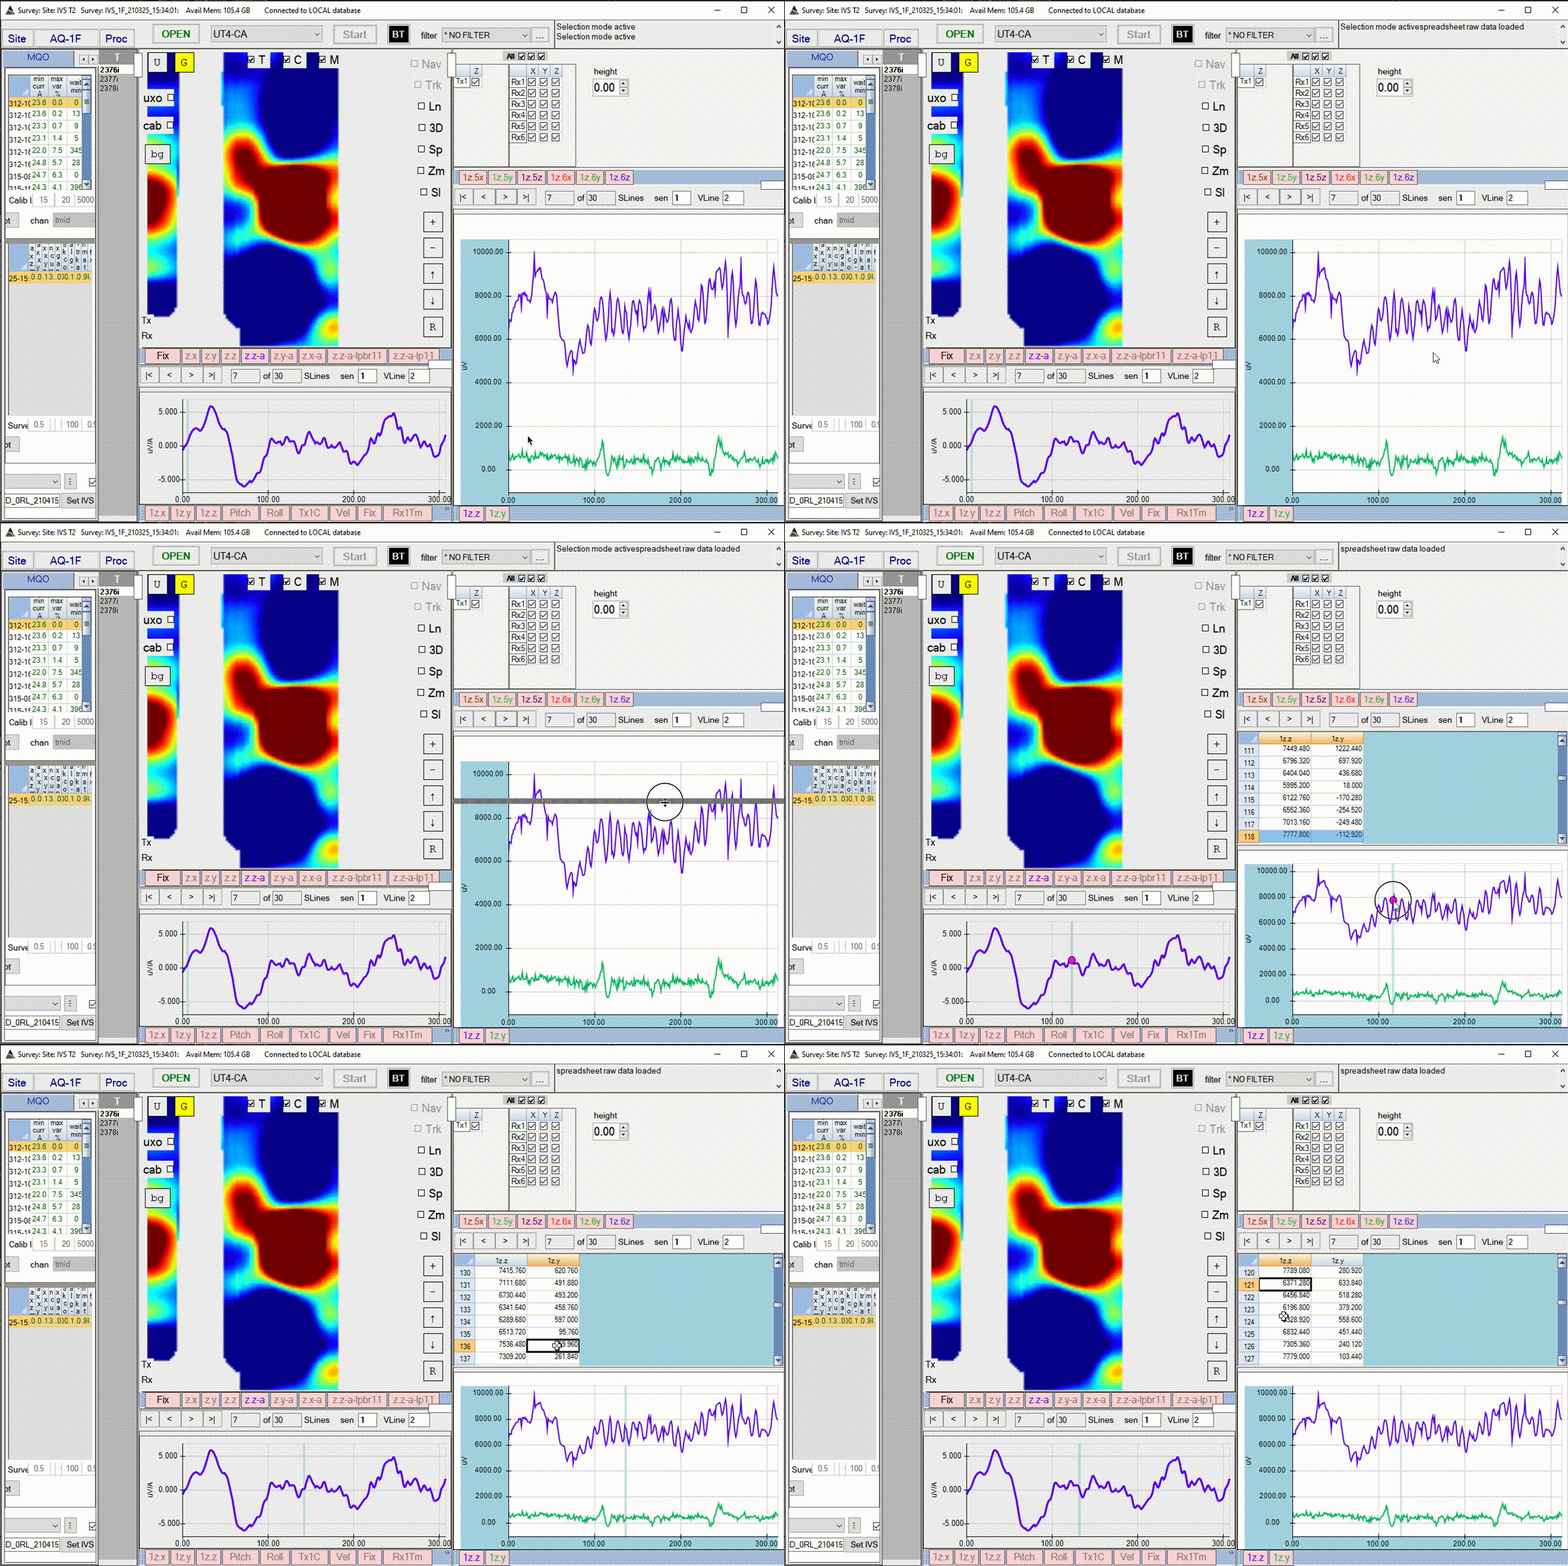
- Furthermore you may view the raw data values by loading a spreadsheet for the view. Right-click and select Load Spreadsheet and then drag the spreadsheet into view. See figure below.
