View Types
There are eleven basic Display View Types in BTField:
-
Single Sensor View: Displays line plots of data collected at/or around selected positions
-
Gridded View: A 2D/3D gridded image of the merged EM data
-
Profile View: Line plots of all merged data along a sensor line
-
Raw Profile View: Line plots of all raw data along a sensor line
-
Single Response View: Bar plots of data collected at a selected position
-
Inversion Results View: View for navigating targets and cells, running inversions, and for analysis.
-
Vehicle Platform View: 3D View of the platform geometry.
-
Status View: A dedicated, larger view of the Status window.
-
Metrics View: A 2D View of inversion metrics and dig lists.
-
Detection Modeller View: A View for determining detection thresholds.
-
Library Images View: A View of library item photos.
View Layouts
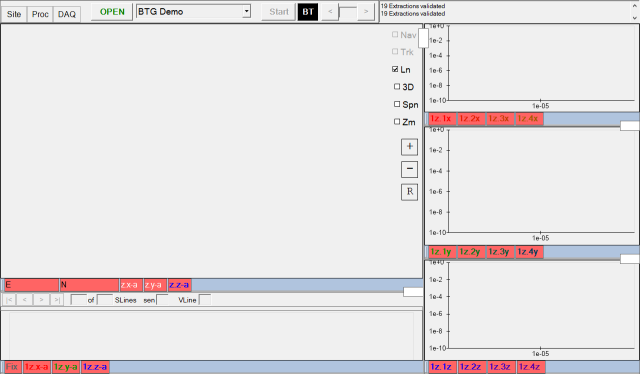
BTField supports user defined Display View layouts for each BTField project. These layouts can be further customized by the user for each machine. For example, User A may be only interested in the data collection aspect, so they may just use a layout that has as Gridded View (top left), a Profile View (bottom left), and three Single Sensor Views (right side) as shown here:
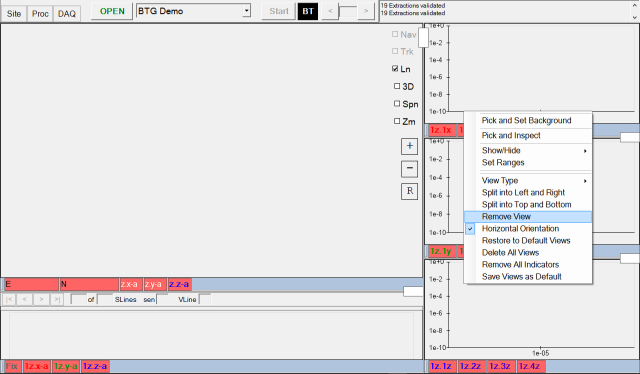
On a different machine, User B may be more interested in analyzing and
inverting the data. BTField allows them to modify the layout for their
machine. For example, they may not be interested in looking at the
Single Sensor Views on the right side (Rx decays). They may want an
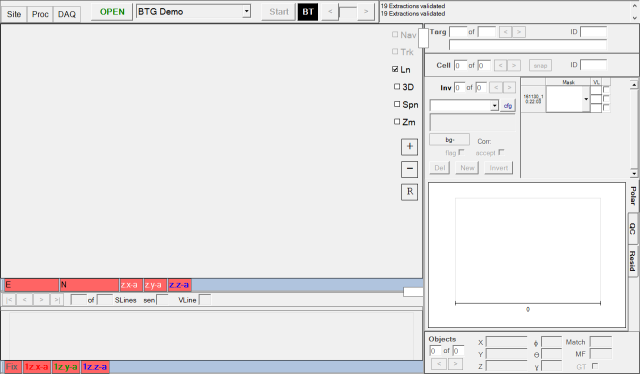
Inversion Results View instead. The Single Sensor Views can be
removed by right clicking and selecting Remove View like this:
After removing the first two Single Sensor Views, the user can change
the remaining one to an Inversion Results View as shown here:
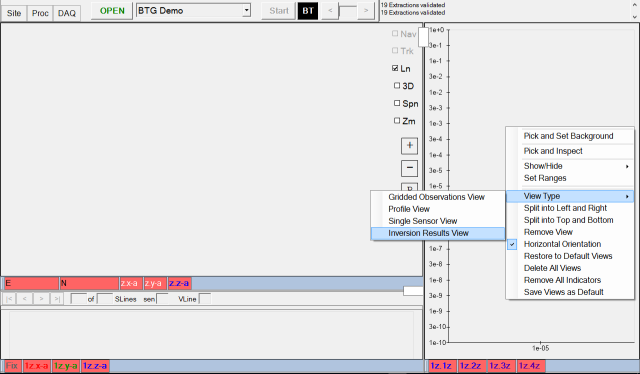
Now they have a layout that is more suited to processing and analysis:
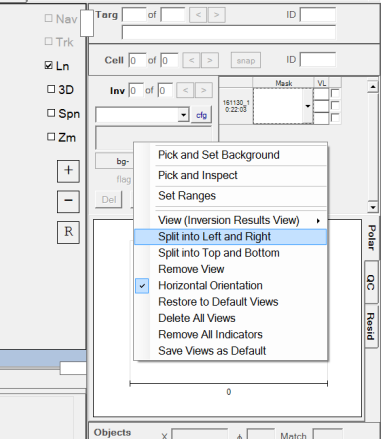
If they wanted to add the Single Sensor Views back in later, they
could right click on the Inversion Results View and select Split
into Left and Right:
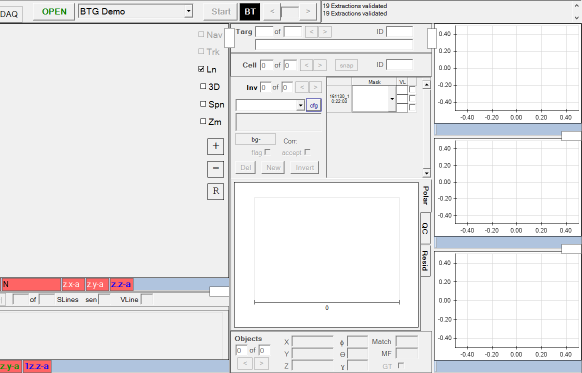
The new panel on the right side, could then be split into Top and
Bottom twice, yielding three new panels which can then be set to
Single Sensor Views. Here is the final result:
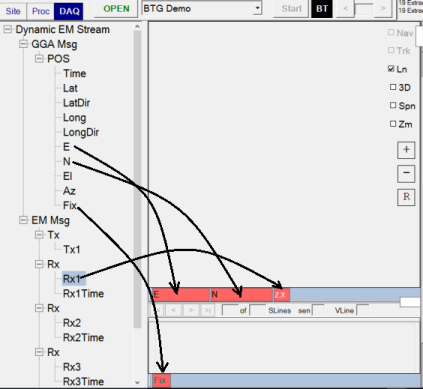
Connecting Raw Data to Indicators
In the DAQ tab, a user can connect raw data outputs to the views using drag and drop operations as shown here:
Each indicator can be configured by right clicking on the indicator.
For example, an indicator on the Gridded View could be set to display
the Time Gate 8 for the Z and X component combinations:
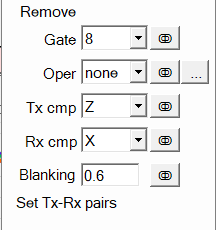
The Tx-Rx pairs also need to be set. This determines which
Transmitter and Receiver pairs will be used for the gridded display
when the indicator is selected. In a single transmitter system, such
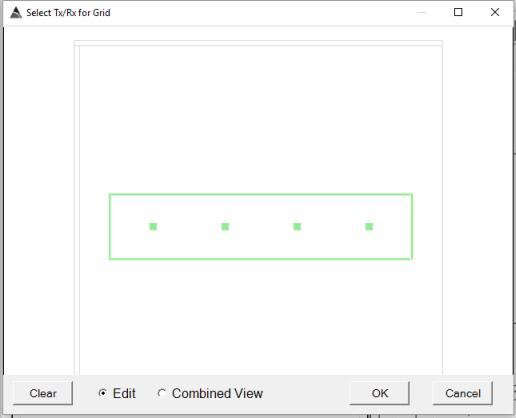
as what is shown below, all Tx-Rx pairs would typically be selected.
Click on Edit and click on each Rx square to activate all Rx sensors
as shown here:
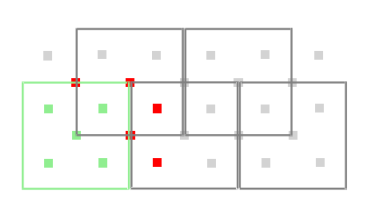
In a multiple transmitter system, the user may only want to select
specific Tx-Rx pairs to optimize the gridded display for their desired
analysis. For example, in the five-transmitter system shown below, the
user may only want to select Rx sensors that are close to the
transmitter. The first Tx has been selected and only the 5 inner Rx
sensors will be paired with it for gridding:
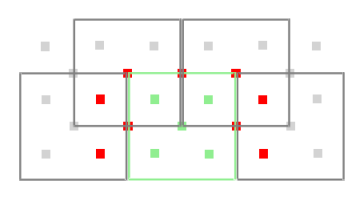
The second Tx can be selected next, and again only the 5 inner Rx sensors could be selected:
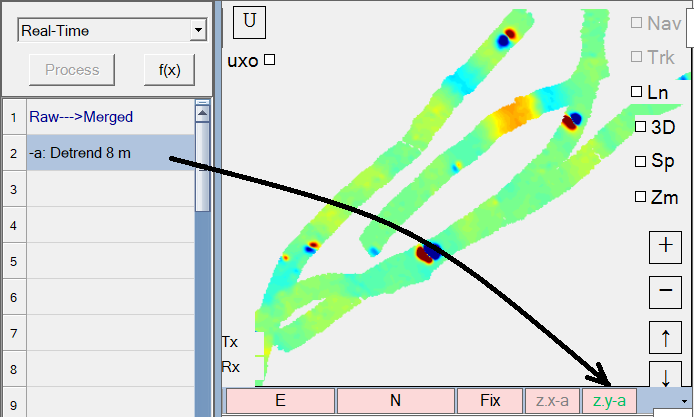
Connecting Processed Data to Indicators
In addition to raw data, processed data from the processing flow can be connected to the indicators on a View. For example, the Detrend function at step 2 in the flow can be dragged and dropped onto the indicator bar of the gridded view as shown here:
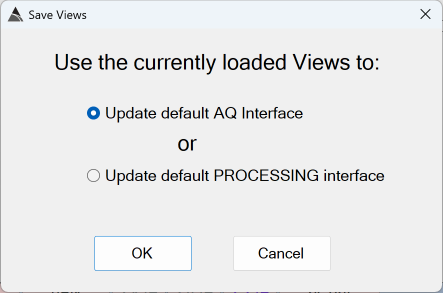
Saving a Default Interface
Once a user has finished configuring their views and connecting indicators for raw and/or processed data, they can save the layout and associated flows by right clicking on any view and selecting Save as Default Interface on the menu as shown here:
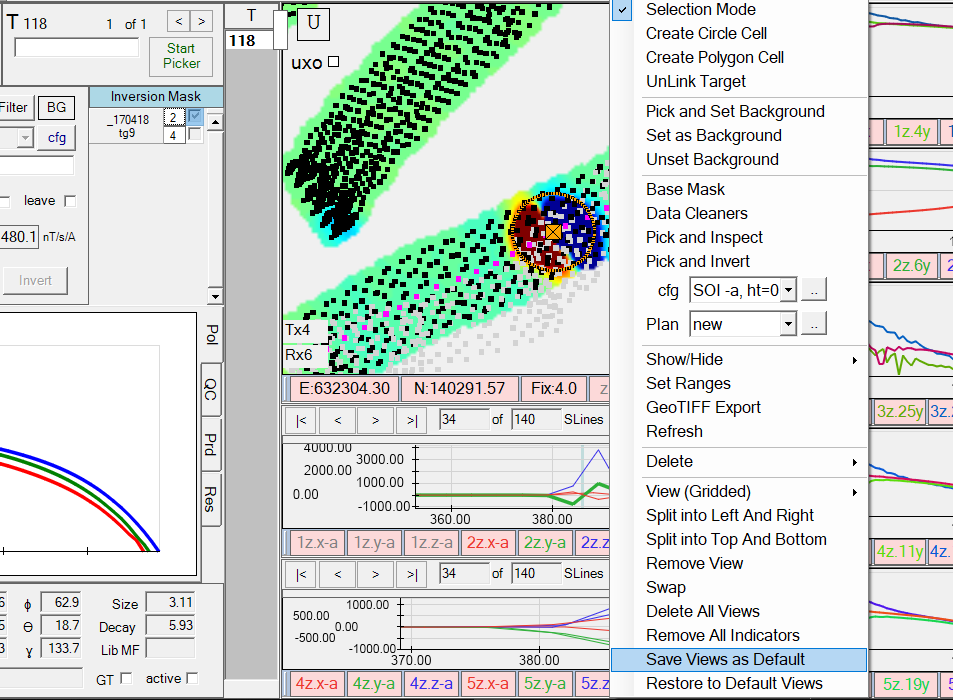
If prompted, enter the password su6vu2*K. The current layout and associated flows can be used to update either the Defaut AQ Interface or the Default PROCESSING Interface. The views in this example are tuned more for data acquisition, so the user has chosen to update the Default AQ Interface: