Project Settings for Data Collection
To edit the project settings for data collection, click on the black square BT button at the top of the application:

click on Project Settings and configure the settings for your project.
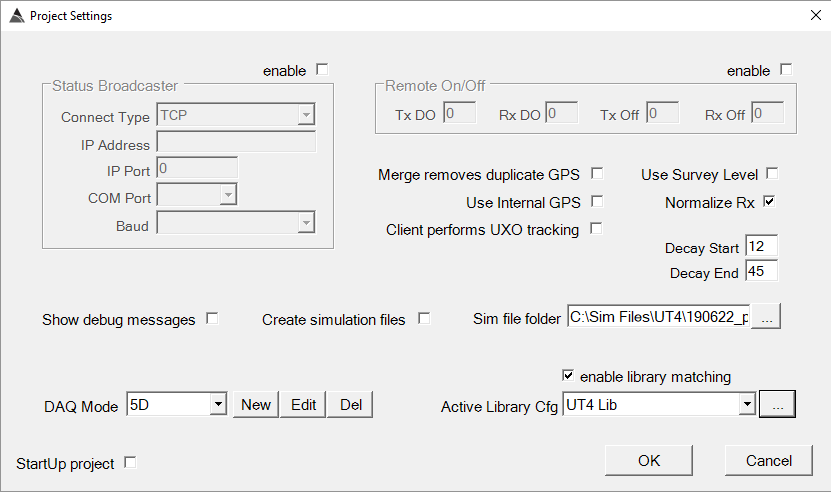
Here is a description of each option:
-
Status Broadcaster: Sends status messages to an external system to indicate data quality.
-
Remote On/Off: Control for powering on/off external devices.
-
Cient performs UXO Tracking: Allows a joined networked client machine to do the tracking, rather than the machine that’s collecting the data.
-
Validate Fix on P and IVS: When checked, the real-time grid will only update when Fix is 4.0 or higher (when collecting P and IVS surveys)
-
Tx Off during Transit: Option to automatically turn the transmitter off when transitting during cued acquisition.
-
Use Survey Level: Option to require a Survey Level selection when opening a new survey.
-
Normalize Rx: When checked, the merged EM observations will be normalized by the Tx current.
-
Use Internal GPS: Option for testing without valid GPS data.
-
Use Variable BG: Option to pre-collect a survey that will used later for extracting variable background observations. The Variable BG survey is used to capture not only the ground response, but also any surrounding metallic structure that is known to always be present during the P or IVS survey data collection.
-
Sensor for heading: Option to use the Yaw value from the ATT sensor, or use differential GPS locations.
-
Use fixed heading: When checked, the fixed heading entered will be used throughout the survey collection. This is sometimes used for stationay dry-land testing when an ATT sensor is not available or streaming.
-
Create simulation files: Determines if the raw sensor stream data will be saved to disk for the purpose of analysis and/or re-collection.
-
AQ Cfg: A selectable mode of operation for data collection. Each mode can use different EM hardware operating frequencies, data consumption settings, and include/exclude different sensors.
-
Show debug messages: Determines if extra diagnostic messages appear in the status window.
-
StartUp Project: Determines if the current project will load first when launching BTField.
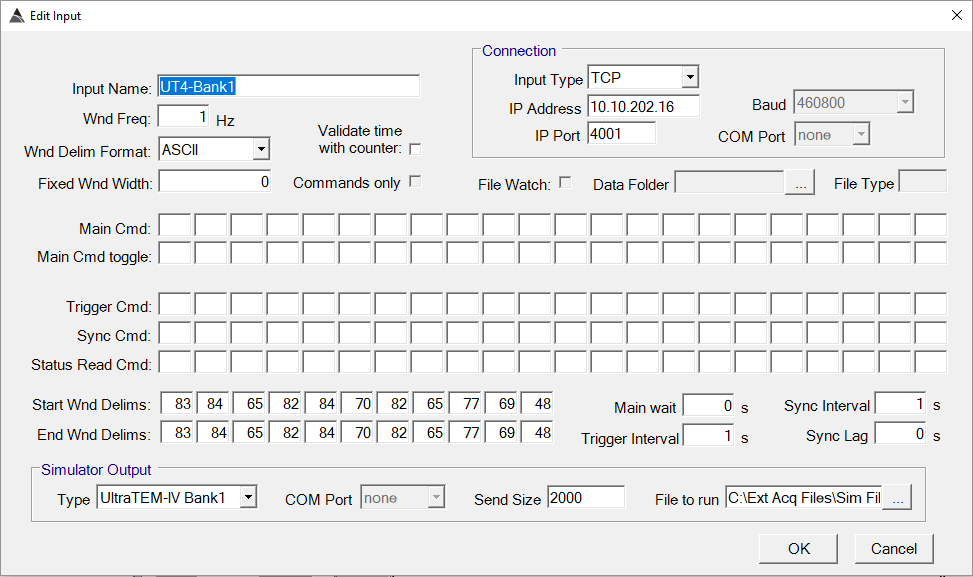
Connecting to Sensors
In the field, a data collection computer is always the Control Computer because it hosts the database and it allows the operator to Start and Stop data collection. The Control Computer will be connected to the sensor inputs using the Input settings in the DAQ tab. Right clicking on an input node will allow you to Edit the input settings as shown below. This example shows a connection to a TCP stream of EM data found at IP 10.10.2002:16 on port 4001. Alternatively, BTField can connect to serial COM streams for sensors that do not output TCP or cannot be connected through a Serial Device Server (a device that converts serial COM to TCP).
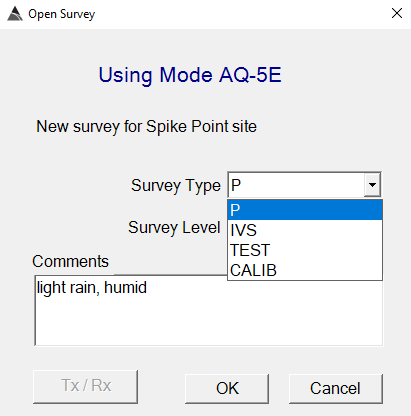
Survey Types
Before opening a new survey, the real-time processing flow should be configured as described in section 4 – Configuring the Real-Time Flow. Once the real-time flow is configured, click the OPEN button to open a new survey. Type in any relevant comments, and select either a P (production), IVS, TEST, or FT (Function Test) survey type:
-
P: Production Surveys: All dig/no dig decisions are made from the inversion results of P surveys. A P survey can only be collected using a BTField project that is registered by Black Tusk Geophysics. Also note that the Master survey for a site can consist only of P surveys.
-
IVS: Instrument Instrument Verification Strip surveys
-
AHRS: AHRS surveys are used for acquiring bi-directional lines, allowing for processors to check sensor positioning.
-
TEST: Test Surveys: A TEST survey is typically used during project development, before the project is registered by Black Tusk Geophysics.
-
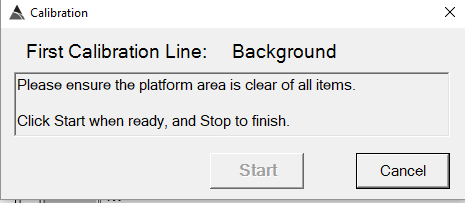
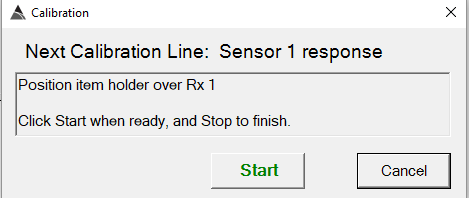
FT: Function Test (FT) surveys are used to check the repeatability of the EM sesnors by comparing them to a reference FT. When opened, the FT survey will instruct the user to first collect a background measurement, then ask them to move the test item from sensor to sensor while collecting data using the Start/Stop line button as shown here:
 |
 |
|---|
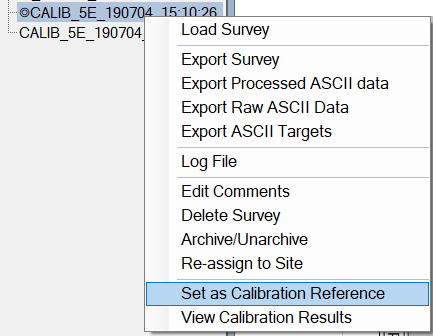
Any FT survey can be set as the reference FT when clicking the MQO Calc button, as shown here:
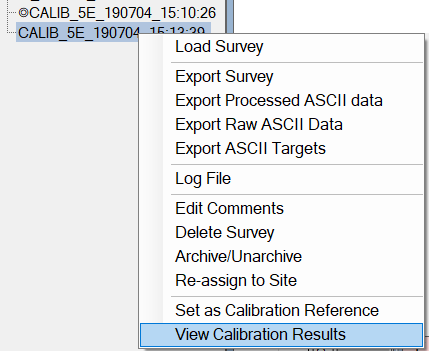
Once the reference FT survey is set, other FT surveys can be compared to it by selecting Compare with Ref as shown here:
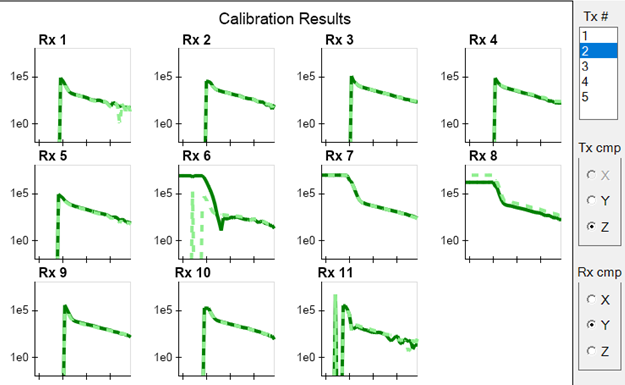
Here is an example of the Function Test results for a 3 Tx, 6 Rx
system. Any combination of Tx and Rx components can be viewed. The
FT reference responses are shown with a dashed line, while
the responses being tested are shown with a solid line:
Navigation modes
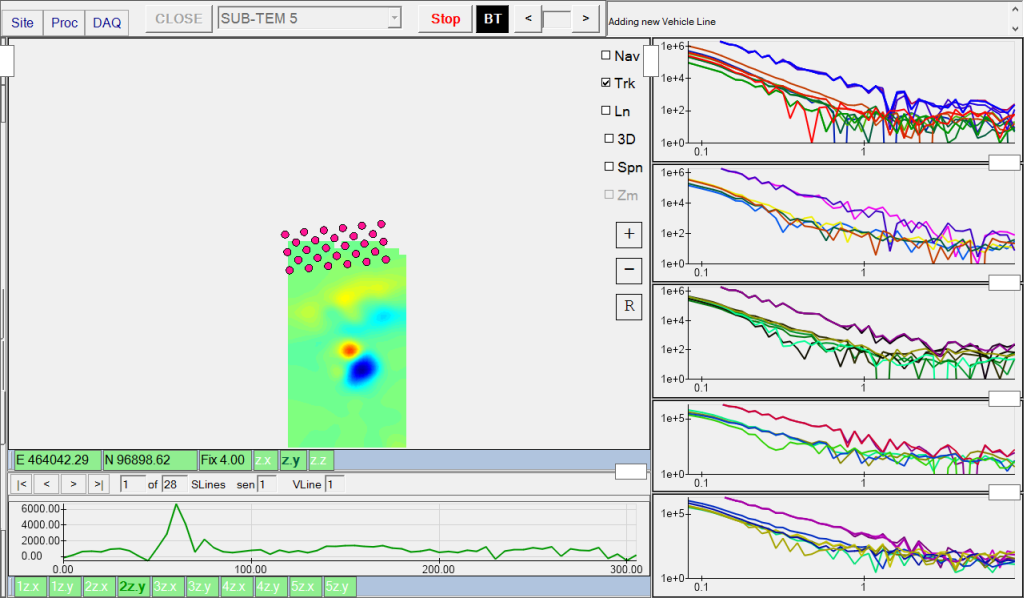
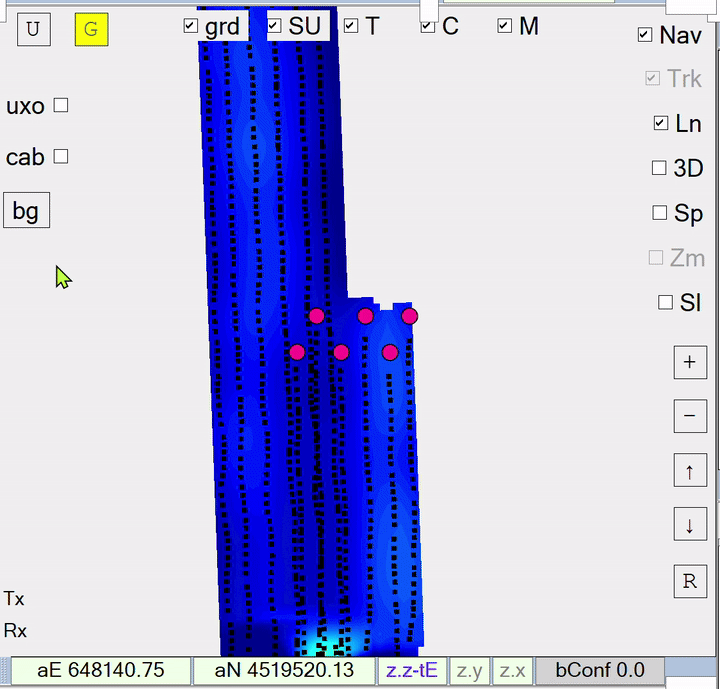
Once data is streaming, click the Start button to begin data collection along the first vehicle line. The real-time grid will appear as shown below, indicating that data is being collected and saved to disk. The small round, red circles indicate the sensor positions on the platform. At any time, the user can switch between a vehicle-centric view and geographic view using the Nav checkbox on the top right side of the Gridded View. The user can also use the Trk button to switch between tracking mode and analysis mode if they wish to inspect or invert an area while the data collection is still active.
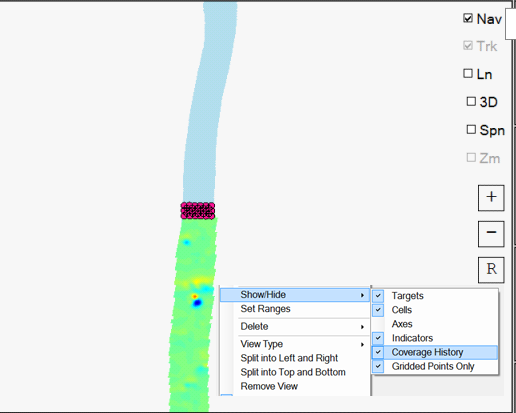
Coverage History
During data collection, the user can display a light blue path for all surveys previously collected in the Site. Right click on the Gridded View and select Coverage History as shown here:
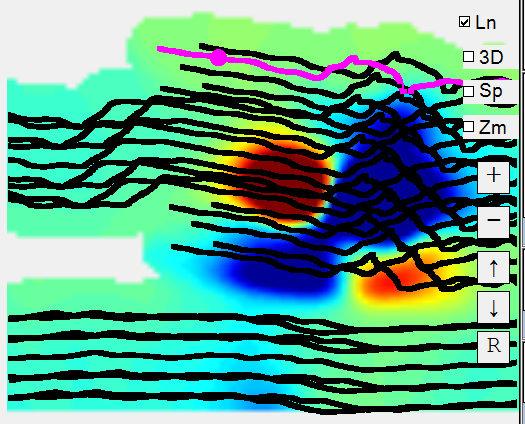
Real-Time Classification
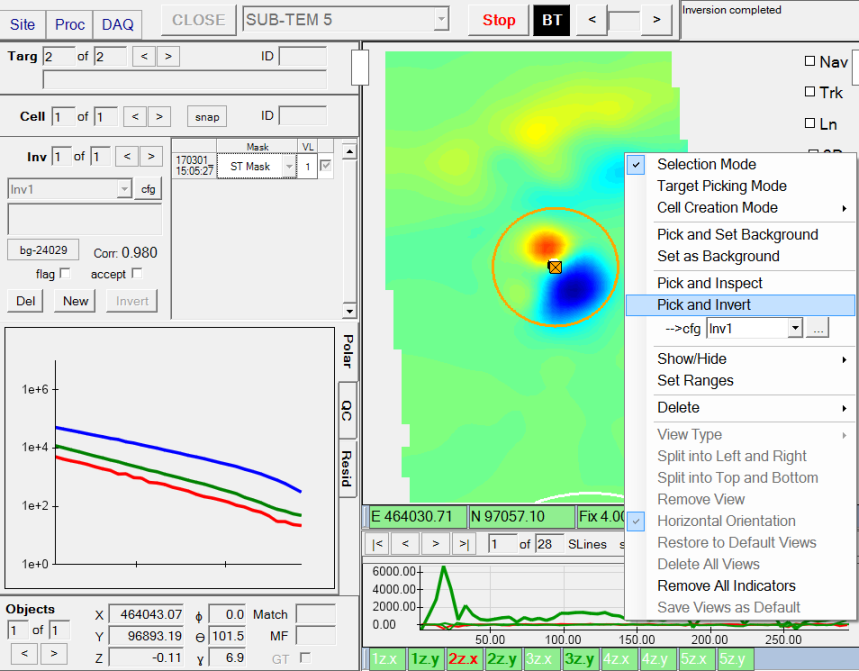
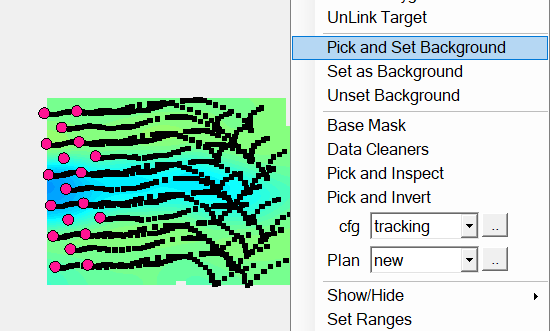
During data collection, the user can exit tracking mode by unchecking the Trk checkbox, allowing them to zoom in on an anomaly of interest and immediately invert it using the Pick and Invert tool as shown below. The Pick and Invert tool allows the user to click and drag outward to create a target and cell, followed by a mouse release that immediately runs the inversion. This provides an easy method of quickly investigating an anomaly in real-time without stopping data collection.
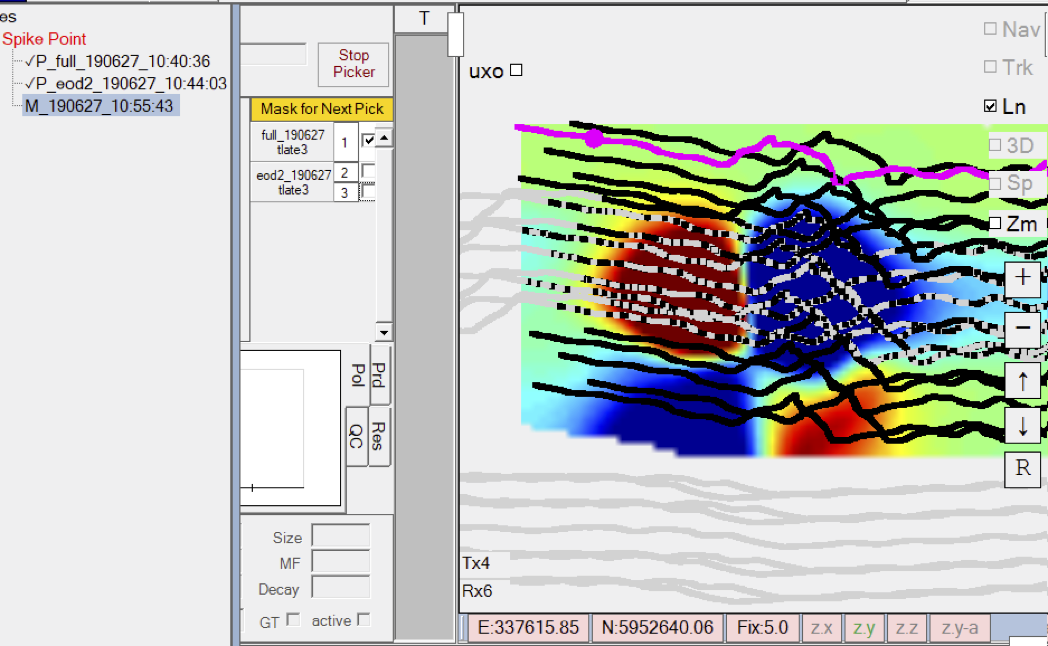
Real-Time UXO Tracking
BTField can also perform real-time uxo tracking if the user creates an inversion configuration with the “UXO tracking” option checked. This provides a robust way of tracking uxo in real-time since full inversions are continually being performed on the incoming data. An example of an inversion configuration with uxo tracking enabled is shown below:
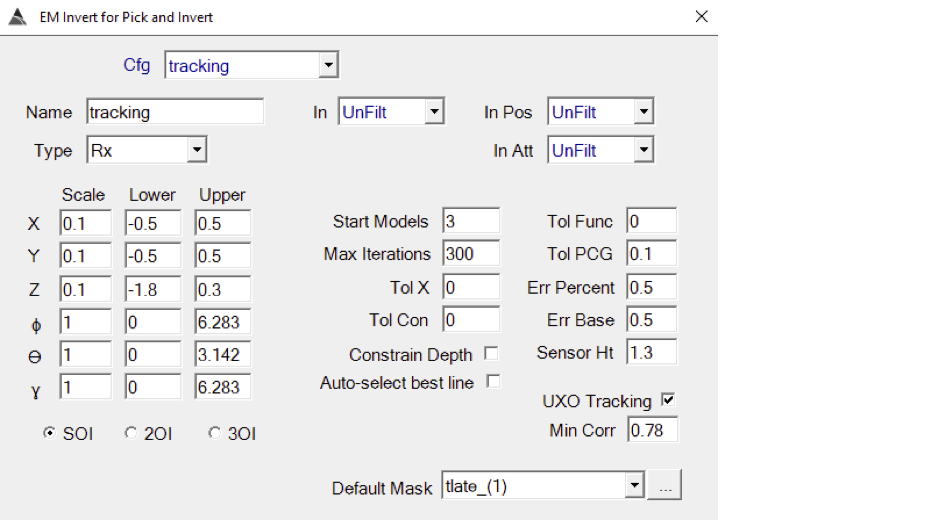
Note that the inversion configuration we are using for uxo tracking in
this example is using the unfiltered (unfilt) data as input,
allowing the inversion to proceed as soon as the data arrives.
To support this, a Subtract BG function must be inserted in the Real-Time flow first as shown here:
Once a new line is started, the bg button will appear on the left side of the Grid View as show here, and the operator can click it at any time to automatically acquire a background:
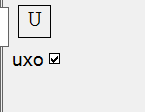
Now the “uxo” checkbox can be switched on in the upper left corner
of the Grid View:
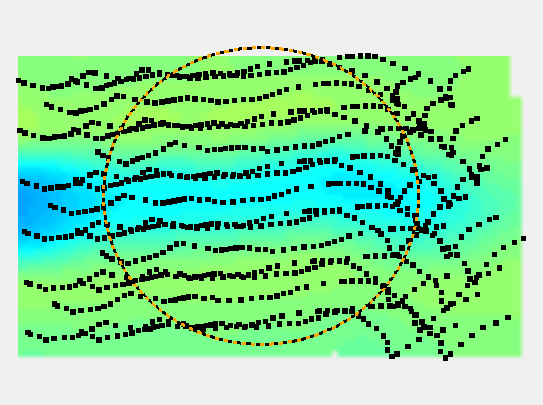
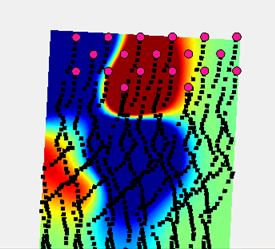
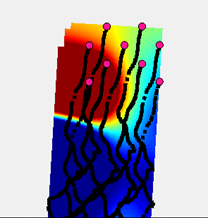
Here is an example of the uxo tracking switched on as it continually
inverts the most recently consumed data: The black circle in the
screenshot below indicates the detected depth below ground. The operator clicks the ‘bg’ button first to acquire a background, and then checks the ‘uxo’ checkbox to turn on the tracking. The black dot will keep displaying over the detected location as long as the platform is near the item and the data fit exceeds the set threshold. Once the platform moves completely past the item, the track will be dropped.
Switching between DAQ Modes
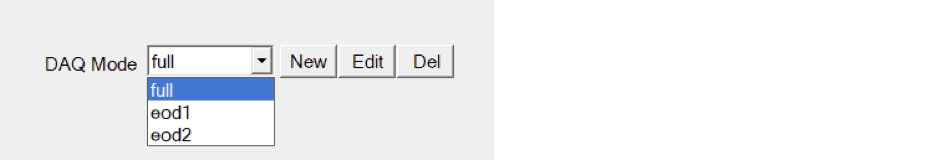
Some sensor platforms have the ability to operate at different frequencies, and/or have different sensors active, and/or can be configured with different sensor geometries. BTField allows the user to easily switch between these different modes of operation using the AQ Mode drop down list in the Project Settings dialog. This allows all users to remain within the same BTField project while continuing to collect, analyze, and process data regardless of the mode. It also allows the creation of a Master survey that can contain a mix of surveys collected in these different modes.
Here is a sample marine project where three modes have been created. They are named full, eod1, and eod2, and they are selectable from the Project Settings:
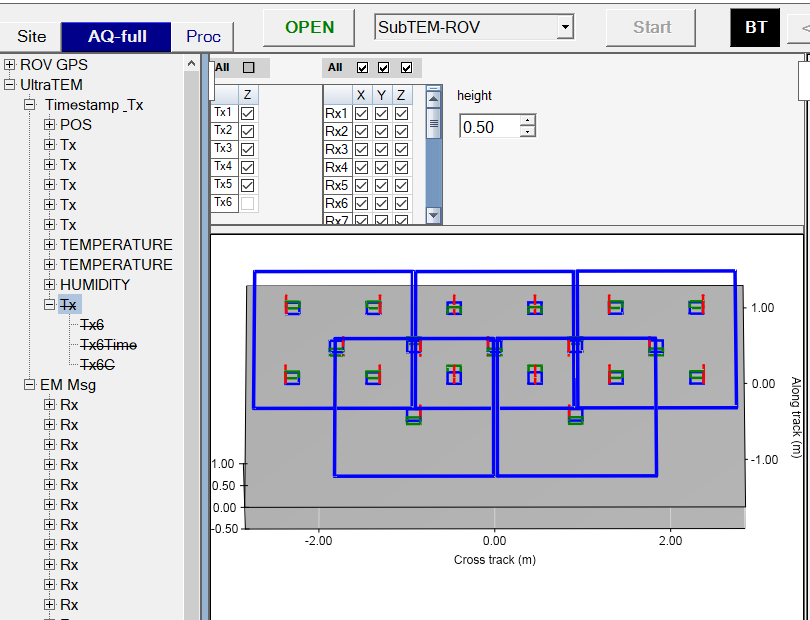
In the DAQ tab, each mode looks very similar, except that some sensors
may have different data consumption settings, and other sensors may be
excluded. In the “full” mode show below, transmitter 6 (Tx6) is
excluded while the other five Tx and all eleven Rx and included:
During collection, the operator will see all eleven Rx consuming data:
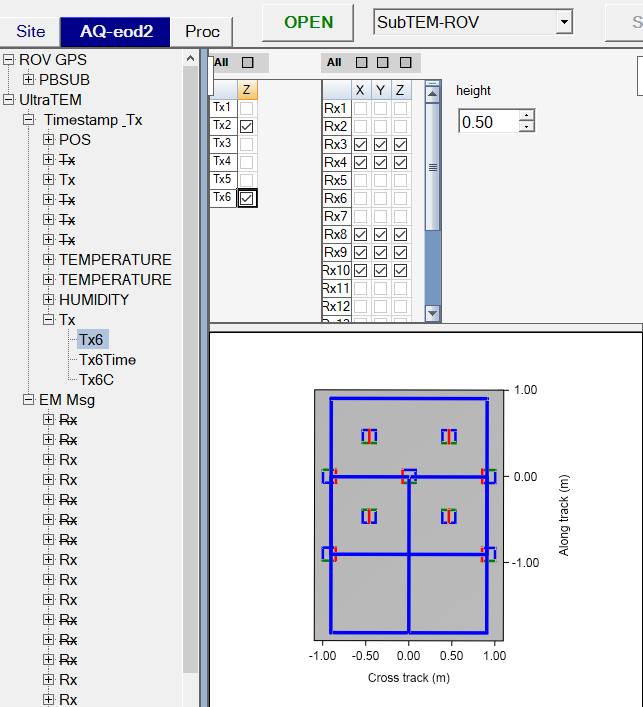
If the operator switches to the “eod2” mode, for example, then only
Tx2 (the front-middle rectangular loop) and Tx6 (back-middle figure 8
loop) are actively transmitting, with only the middle nine Rx sensors
(3, 4, 8, 9, 10, 14, 15, 18, 19) actively sensing:
Now during collection, the operator will see only the middle nine Rx
consuming data:
BTField will allow a Master survey to be created using surveys
collected in each of these modes. Here is a Master survey example that
combines our full and eod2 surveys:
The Master survey provides additional control to turn off specific
vehicle lines. For example, if the user wanted to look at only the
full mode data in this area, they can turn off lines 2 and 3 which
were collected with eod2: