Loading Surveys
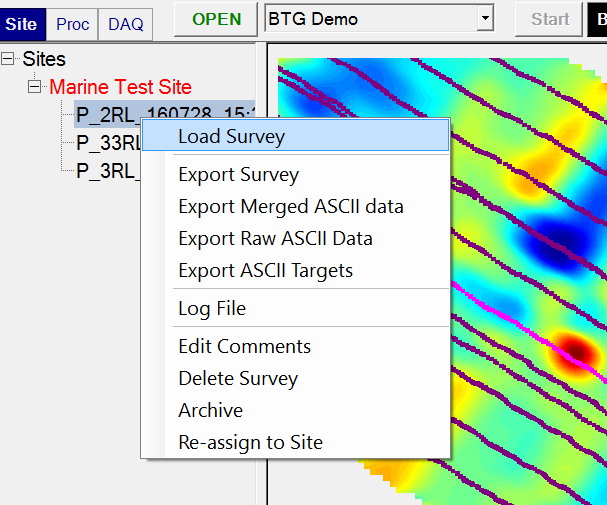
An existing Survey can be loaded by double clicking on the survey, or by right clicking and selecting Load Survey as shown here:
Gridded View
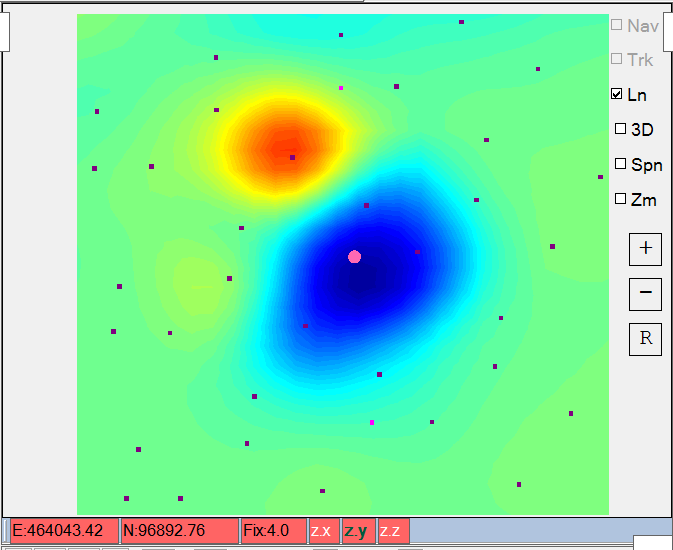
The Gridded View is the main display window that shows a gridded area of observations using the Tx-Rx-Time Gate configuration of the indicator that is currently selected. For example, the z.y indicator is selected on the Gridded View show below, displaying a grid of the observations with the z Tx loop energized and y Rx loop sensing the response:
Profile View
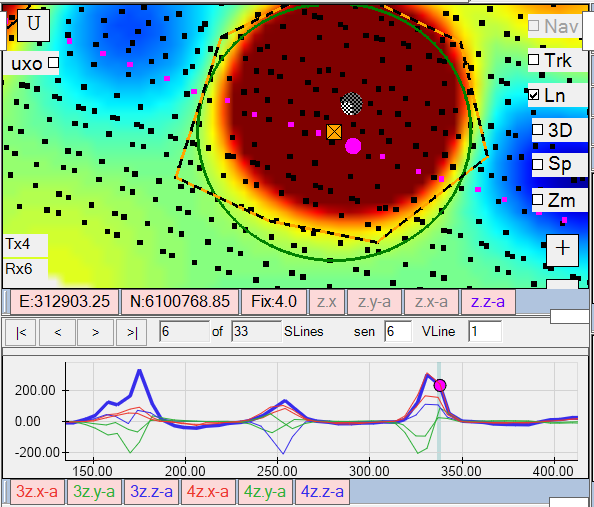
The Profile View displays all observations along a sensor line using the Tx-Rx-Time Gate configuration of the currently selected indicator. For example, the bold blue line in the Profile View shown along the bottom below, is displaying the detrended data (-a data state) for the Z loop of Rx 6 (sen 6), with the Z loop of Tx4 energizing and the Z loop of the Rx sensing the response (all noted by 4z.z -a on the profile indicator). The highlighted pink dot is the selected EM sounding location, which is also synchronized with the Gridded View above it. The blue line is in bold to indicate that its data state (-a), Tx-Rx pair combination (Tx4 and Rx6), and component combination (TxZ and RxZ), all matches the data that is currently gridded in the Grid View.
Raw Profile View
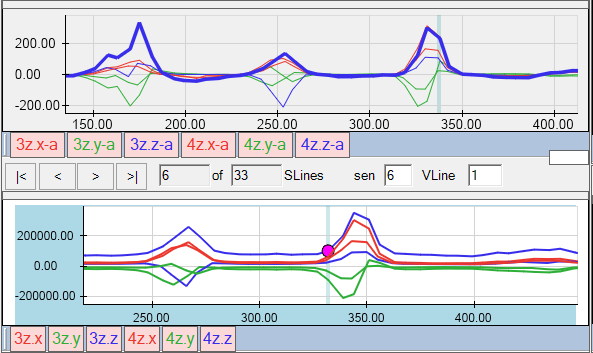
A raw profile view is sometimes required to examine data before it has been merged and normalized by the Tx current. A raw profile is shown here below the regular profile view:
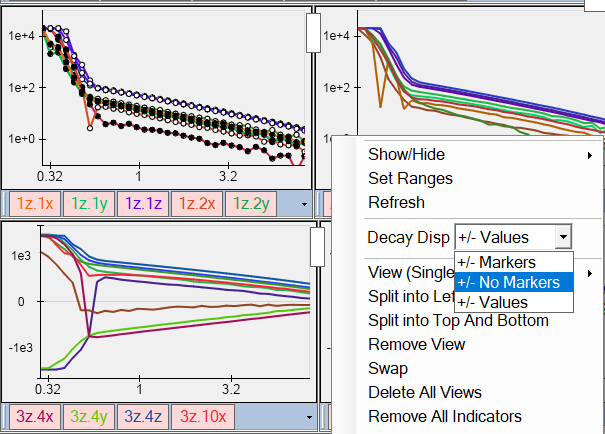
Single Sensor View
A Sensor View will display a line plot of the data values collected at a selected sounding location. The decays can be viewed with Markers (upper left), No Markers (upper right), or +/-Values (bottom left):
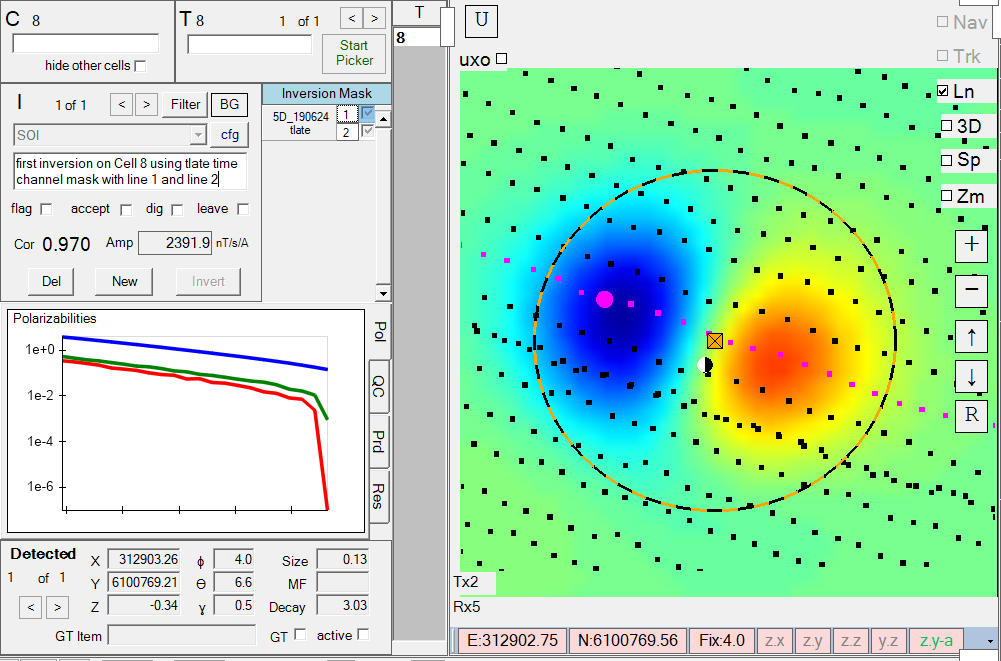
Inversion Results View
The Inversion Results View is the main view for navigating targets and cells, running inversions, and analyzing classification results. The example below shows the Inversion Results View on the left side. A cicular cell has been inverted around a target pick (orange square). The resultant polarizabilities are shown on the left with a Data Fit of 1.00, and a Match of 0.92 to a Small ISO.
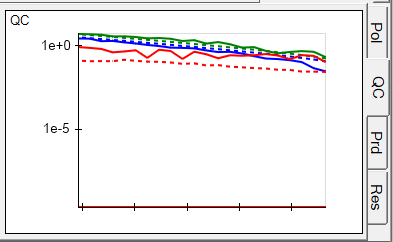
The QC tab will display all resultant polarizabilities for the target. This example is showing results for a Single Object Inversion (SOI), a Two object inversion (2OI), and a Three Object Inversion (3OI), comprising a total of 1+2+3=6 polarizability plots.
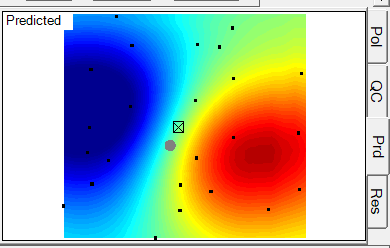
The Inv button, will display a gridded view of all
sounding locations within the circular cell, allowing the user to
immediately compare the predicted grid with the currently selected time gate for the Grid View. To perform these comparisons, the grid view indicator must first have the Oper set to ‘none’ and a time Gate must be selected:
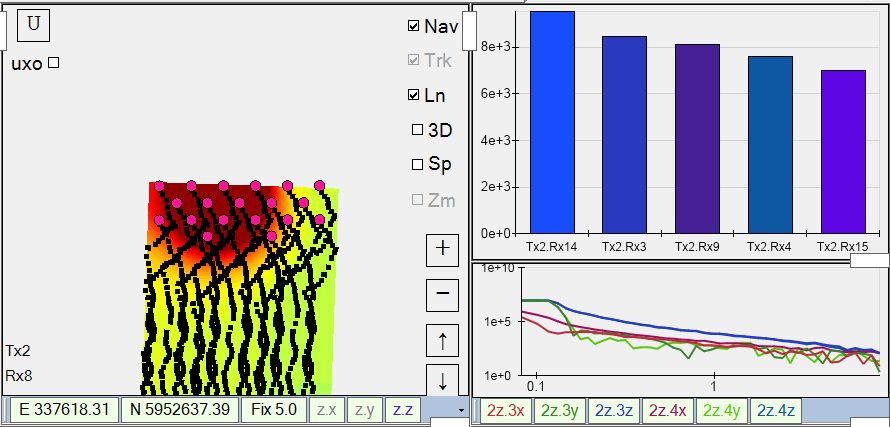
Single Response View
The Single Response View can be used for displaying responses from specific Tx-Rx pairings on bar graphs. This can provide an easy way to determine the approximate xy location of an anomaly during data collection. For example, here is a marine system using the full mode with a Single Response view set up for the inner sensors. As the platform passes over the anomaly the bars indicate the Z component response:
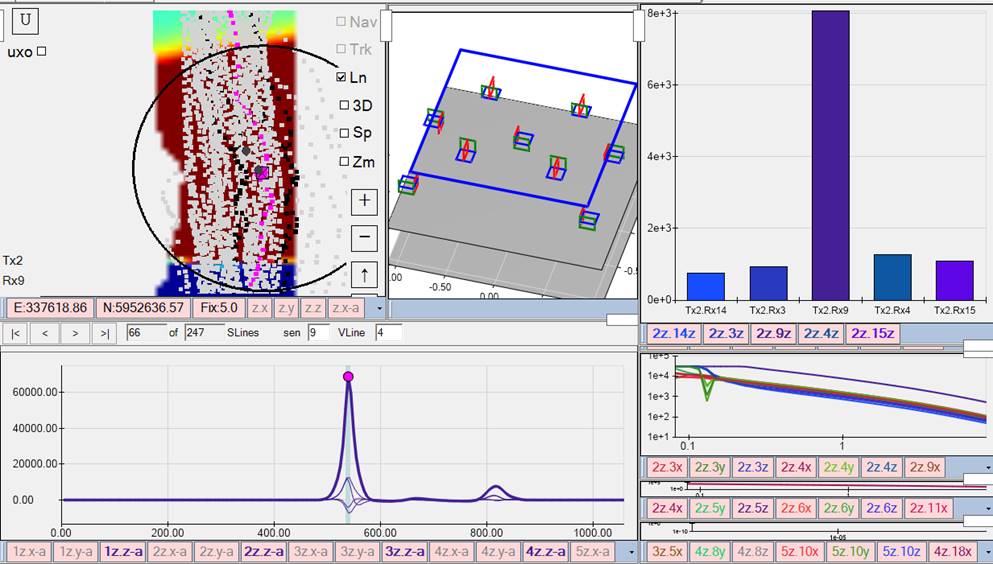
Here is another example with the platform running in the eod2 mode with only the inner sensor active. In this case the platform is passing directly over an anomaly, yielding a dominant response on the middle Rx9 sensor:
Vehicle Platform View
| The Vehicle Platform view provides a 3D zoom/rotatable model of the system. The platform height can be adjusted up or down, and the visibility of each Tx/Rx sensor can be toggled to fully verify sensor geometry. | 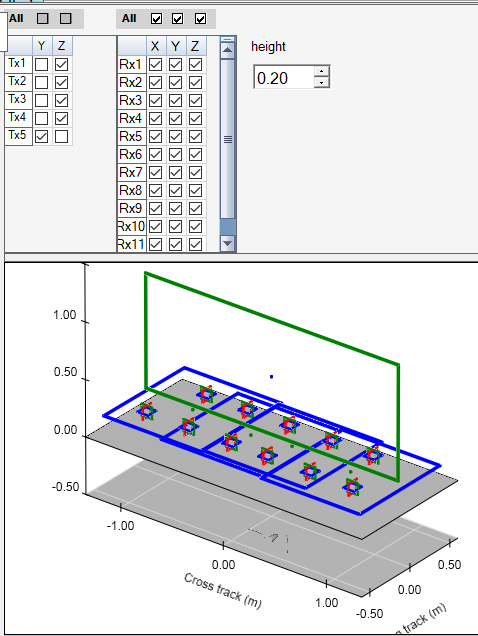 |