Prerequisites
Before attempting the IVS processing workflow the user should first,
- Import and configure an IVS specific ordnance library
- Import ground truth seed locations.
- Import surveys.
Workflow
Instrument verification strip (IVS) processing workflow is described in detail in the following sections.
Pre-processing
Note: Below is a basic configuration suitable for processing. You may configure an advanced processing flow by following the instructions in the Appendix: Advanced Processing Flow.
- Load the IVS survey by double clicking on an IVS survey type in the site tree view.
- Merge and detrend the survey, either by selecting Batch Process Surveys from the Site node or by clicking on the Proc tab and running the P Flow1.
- Right-click the -a Detrend: 10m function and click edit.
- Confirm the settings are correct.
Load an IVS Survey an run the P Flow1.
Load seeds/ground-truth
- From the MQO tab, click Set IVS seeds.
- The ground-truth should already be imported.
- Click Close and Set Seeds.
Assign a noise polygon
- Identify an area for estimating the noise. Center this on your screen.
- Right-click on the gridded image and select Create Noise Polygon.
- Draw a polygon by left-clicking to create vertices. Note, the final vertex will be assigned by pressing Enter on the keyboard.
Export Noise statistics
Right click on a noise polygon and select Copy Noise Values to copy the Standard Deviation to the clipboard. Example below.
    Tx	TxC	RxC	tg1	tg2	tg3	tg4	tg5	tg6	tg7	tg8	tg9	tg10	tg11	tg12	tg13	tg14	tg15	tg16	tg17	tg18	tg19	tg20	tg21	tg22	tg23	tg24	tg25	tg26	tg27	tg28	tg29	tg30	tg31	tg32	tg33	tg34	tg35	tg36	tg37	tg38	tg39	tg40	tg41	tg42	tg43	tg44	tg45
    1	1	1	1.405	0.000	0.000	1.024	0.637	0.515	0.392	1.321	41.386	3.801	1.473	3.232	1.831	7.879	0.703	2.630	1.022	0.981	0.795	0.694	0.596	0.497	0.444	0.369	0.327	0.268	0.237	0.192	0.168	0.144	0.129	0.116	0.105	0.090	0.073	0.061	0.057	0.051	0.040	0.035	0.035	0.026	0.026	0.022	0.023
    1	1	2	114.424	0.000	0.000	130.046	136.655	138.838	138.286	129.329	110.344	100.710	22.276	4.344	2.664	1.307	0.858	0.598	0.547	0.520	0.370	0.400	0.369	0.281	0.304	0.241	0.195	0.180	0.136	0.106	0.081	0.082	0.069	0.086	0.089	0.070	0.050	0.035	0.045	0.046	0.029	0.031	0.035	0.021	0.028	0.018	0.026
    1	1	3	0.000	0.000	0.000	1.148	0.923	0.860	0.727	0.696	3.349	0.000	1.435	1.858	0.397	0.000	0.000	5.766	3.479	1.740	1.347	1.162	0.978	0.896	0.665	0.586	0.489	0.490	0.367	0.340	0.290	0.257	0.203	0.207	0.165	0.159	0.127	0.111	0.099	0.083	0.071	0.067	0.053	0.049	0.042	0.036	0.032
Delete a noise polygon/cell
- Right-click on the Target selection control and highlight Show/Hide and select Cell List.
- A Cell selection control will appear on the left side of the MQO tab.
- Select the noise cell. Note, these will always be prefixed with “ns”.
- Right-click on the grid, highlight Delete and select Delete Cells.
Invert
- Navigate to the Pick & Invert tab.
- Right-click each of the functions and confirm settings.
- Click Auto-invert to invert all targets currently defined.
- Navigate to the QC tab to view each targets result if necessary.
Calculate the MQOs
Instrument Verification Strip (IVS) Workflow
- Navigate to the MQO tab.
- From the bottom panel, click on Edit.
- Enter in values required for your project/task.
- Click Calc to check the MQOs.
- Export the results of the IVS test to the clipboard. This information can be copied into a spreadsheet for project tracking purposes. Example below.
| Survey | Seed | Targ# | Cell# | Inv# | Src | Fit | Model# | Match | Match>=0.9 | TopMatch | MatchMode | Easting | Northing | Depth | MinCur | Cur>=15 | dXY | dXY<=0.25 | dX | dY | dZ | dZ<=0.5 | phi theta | gamma | Size | Decay | MdCn | |
|---|---|---|---|---|---|---|---|---|---|---|---|---|---|---|---|---|---|---|---|---|---|---|---|---|---|---|---|---|
| IVS_1RL_210326_15:18:55 | 1 | 171 | 300 | 1 | 1 | 1.000 | 1 | 0.97 | Passed | ISO Small ISO_3ms_H-N2#3_d=0.15 | L1 | 217573.01 | 2214224.90 | -0.18 | 23.80 | Passed | 0.04 | Passed | -0.04 | 0.00 | -0.11 | Passed | 1.57 | 1.52 | 1.12 | 0.42 | 2.88 | 100.00 |
| IVS_1RL_210326_15:18:55 | 2 | 172 | 301 | 1 | 1 | 1.000 | 1 | 0.98 | Passed | ISO Small ISO_3ms_H-N2#3_d=0.10 | L1 | 234595.03 | 2216384.30 | -0.15 | 23.80 | Passed | 0.04 | Passed | -0.04 | 0.01 | -0.08 | Passed | 2.87 | 1.70 | 1.91 | 0.38 | 2.92 | 100.00 |
| IVS_1RL_210326_15:18:55 | 3 | 173 | 302 | 1 | 1 | 1.000 | 1 | 0.98 | Passed | ISO Medium ISO_3ms_H-N1#4_d=0.19 | L1 | 217566.67 | 2226434.93 | -0.25 | 23.80 | Passed | 0.08 | Passed | -0.08 | 0.01 | 0.05 | Passed | 3.12 | 1.69 | 0.05 | 1.03 | 2.62 | 100.00 |
Instrument Verification Strip (IVS) Survey Limit Details
The IVS survey limits control is shown below along with an explanation of each value. Each limit represents a threshold at which the MQO calculation will show a failed result.
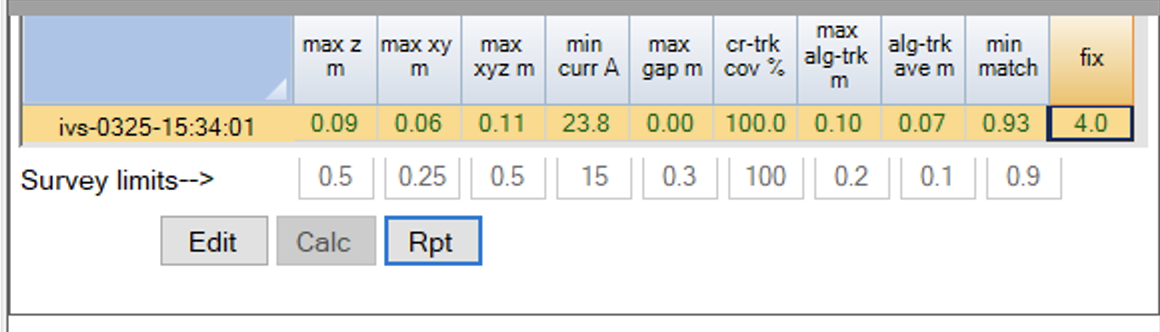
- Seed validation task:
- min match: Maximum allowable value for a polarization match metric.
- max xy m: Maximum allowable of the euclidean distances between ground truth and recovered model locations in the XY plane.
- max z m: Maximum allowable of the distances between ground truth and recovered model locations in the Z direction.
- max xyz m: Maximum allowable of the euclidean distances between ground truth and recovered model locations.
- Data QC and coverage task:
- min curr A: Minimum allowable transmitter current for all data in the current data state. Units are Amperes.
- fix: Current behaviour is for all data to be required to have GPS Fix = 4. The MQO calculation will report failed if any values are not 4 or 4.1, where 4.1 indicates that positions have been interpolated.
- max gap m: This is the maximum allowable distance between receiver locations before a cross-track gap is reported.
- max alg-trk m: The maximum allowable distance between sequential data. This is measured from the center of the array.
- alg-trk ave m: The average distance between sequential data for the vehicle line.
- cr-trk cov %: This reports the percentage of the site polygon that meets data coverage MQOs.
Calibration Test (Calib)
- Navigate to the MQO tab.
- From the top panel, click on Edit.
- Enter in values required for your project/task.
- Click Calc to check the MQOs.
- Export the results of the FT test to the clipboard. This information can be copied into a spreadsheet for project tracking purposes. Example below.
| Ref | Survey | Date | Time | Min Cur(A) | Max Var(%) | TxRxCmp Max | Wait(min) | Status |
|---|---|---|---|---|---|---|---|---|
| Yes | CALIB_1RL_210309_15:47:01 | 3/9/2021 | 5:47 PM | 24.2 | 0 | N/A | 0 | Passed |
| CALIB_1RL_210326_15:26:22 | 3/26/2021 | 6:26 PM | 23.6 | 2.6 | 1 6 3 | 461 | Passed |
Calibration Test (Calib) Details
The calibration survey limits control is shown below along with an explanation of each value. Each limit represents a threshold at which the MQO calculation will show a failed result or warn the user.
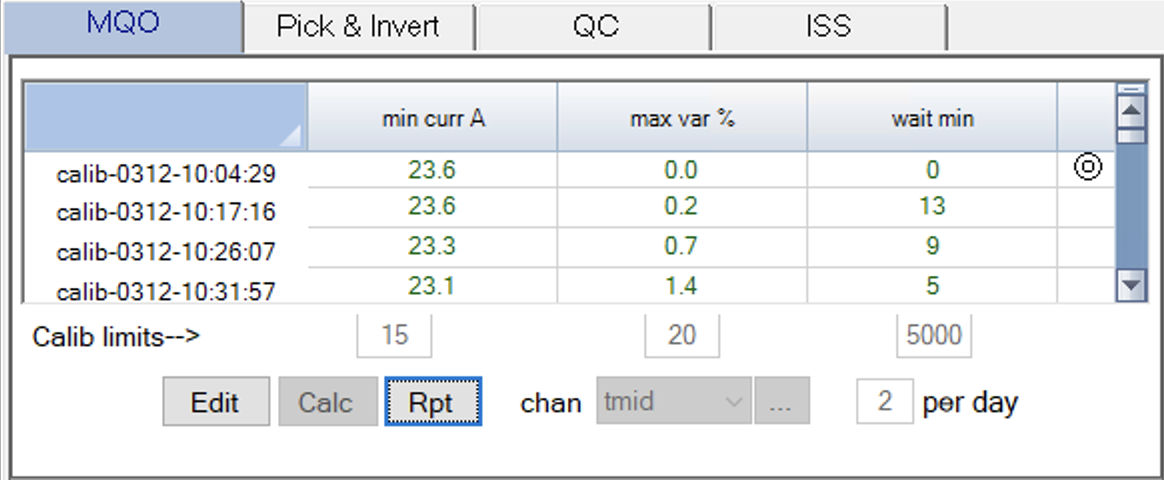
- min curr A: Minimum allowable transmitter current for all data in the current data state. Units are Amperes.
- max var %: Maximum allowable variation percentage allowable.
- wait min: Time between sequential calibration tests. Use this if your project requires a calibration test within a regular interval, otherwise set it to a large value.