Introduction
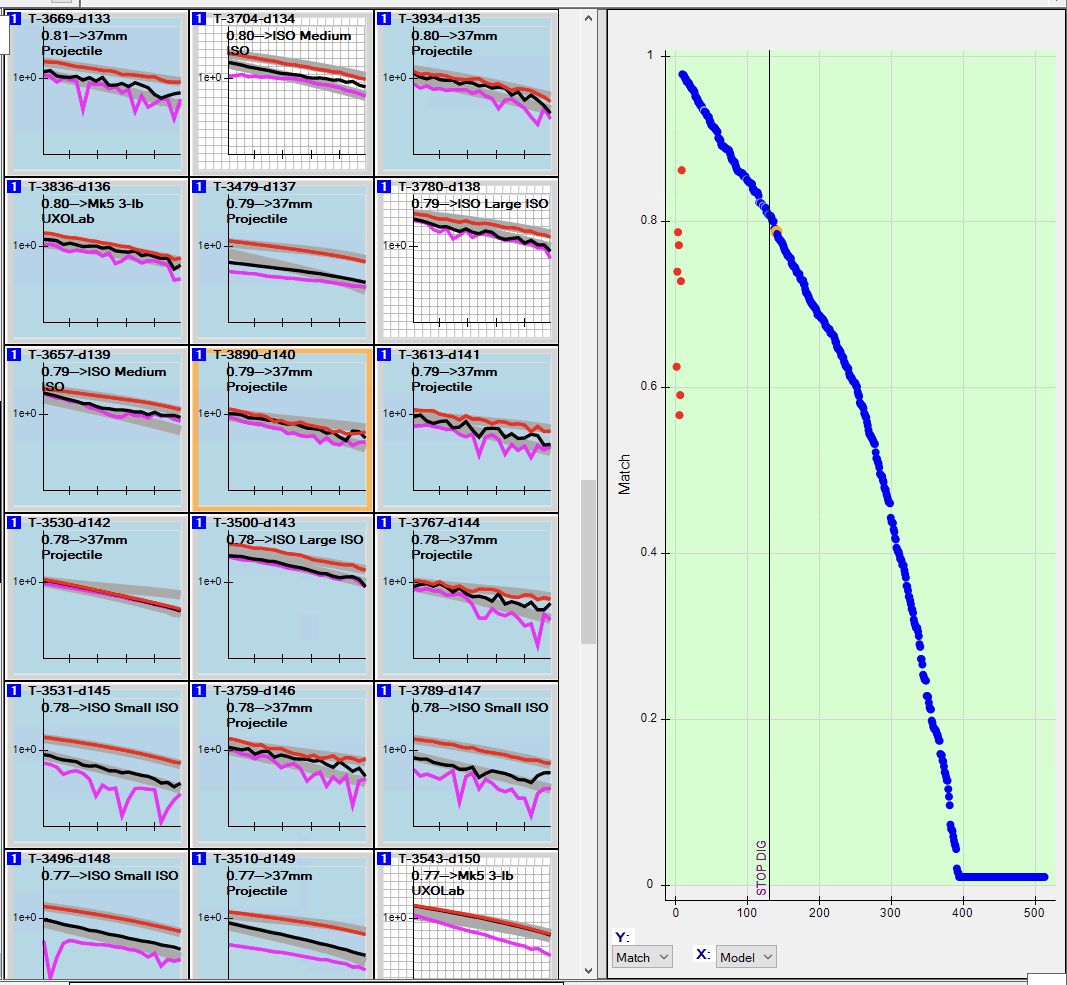
The Metrics view in BTFIeld allows you to review your diglist and query selected models.
Note: As of 15.4.0, the Data Fit metric uses a robust calculation that matches the UXOLab result. Reported Data Fit values may differ from earlier builds.
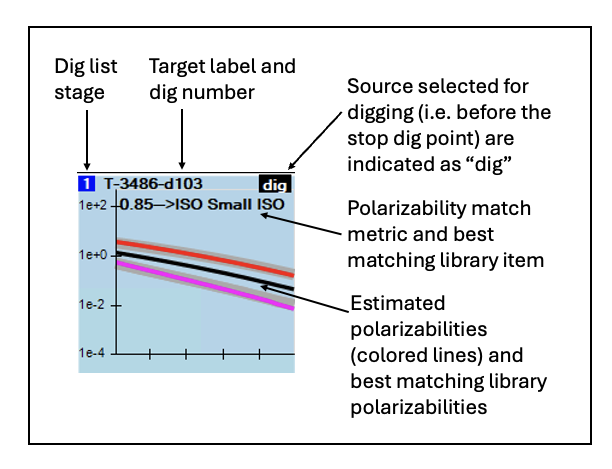
Each subplot in the dig list order shows the match between predicted polarizabilities and the best matching library item:
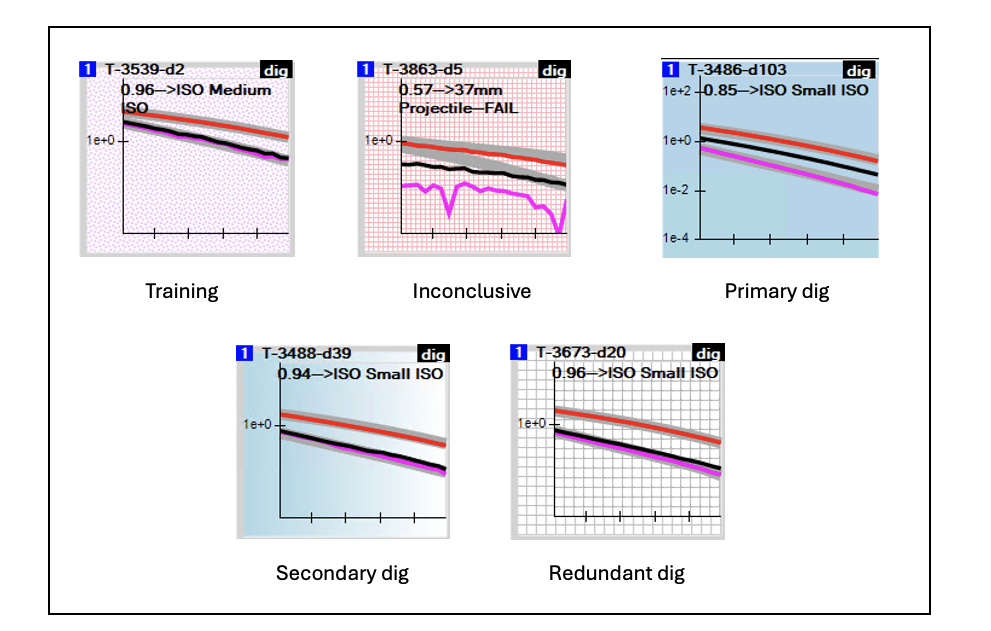
Polarizability plot backgrounds are shaded to indicate the following conditions: